Volume 30, Number 9—September 2024
Research Letter
Optimizing Disease Outbreak Forecast Ensembles
Figure 2
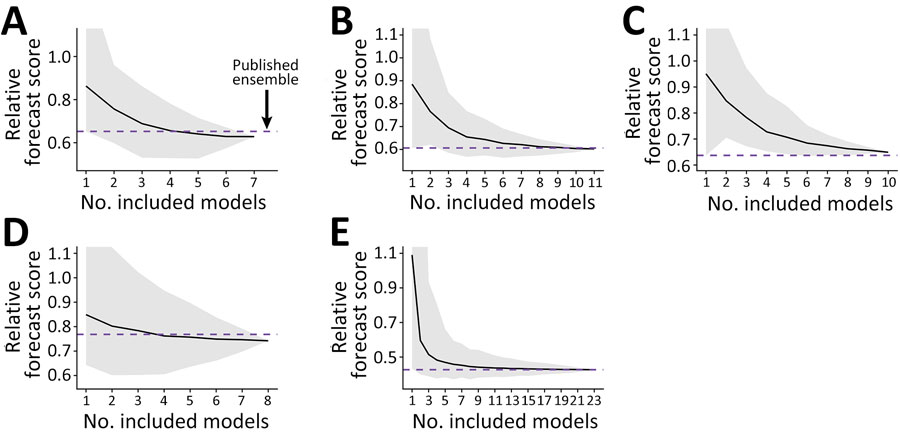
Figure 2. Summarized ensemble forecast scores from collaborative forecast efforts in study of optimizing disease outbreak forecasting ensembles. Scores correspond to the average forecast performance during testing periods across all dates, locations, and forecast horizons (Appendix Table 1). All scores are standardized by the baseline forecast model for that metric (Y = 1). Scores <1 indicate better accuracy than baseline. A) COVID-19 cases with 15 included models. B) COVID-19 admissions with 17 included models. C) COVID-19 deaths with 19 included models. D) Influenza admissions with 21 included models. D) Influenza-like illness with 23 included models. Solid black lines indicate mean scores; gray shading indicates minimum–maximum range. Horizontal purple dashed line indicates unweighted published ensemble used as standard.