Skip directly to site content Skip directly to page options Skip directly to A-Z link Skip directly to A-Z link Skip directly to A-Z link
Volume 30, Number 9—September 2024
Dispatch

Retrospective Seroprevalence of Orthopoxvirus Antibodies among Key Populations, Kenya

Kristi Loeb1, Kieran A. Milner1, Candice Lemaille, Brielle Martens, Derek Stein, Julie Lajoie, Souradet Y. Shaw, Anne W. Rimoin, Placide Mbala-Kingebeni, Nicole A. Hoff, Ryan S. Noyce, Keith R. Fowke, Joshua Kimani, Lyle McKinnon, and Jason KindrachukComments to Author 
Author affiliations: University of Manitoba, Winnipeg, Manitoba, Canada (K. Loeb, K.A. Milner, C. Lemaille, B. Martens, D. Stein, J. Lajoie, S.Y. Shaw, K.R. Fowke, J. Kimani, L. McKinnon, J. Kindrachuk); Cadham Provincial Laboratory, Winnipeg (D. Stein); University of Nairobi, Nairobi, Kenya (J. Lajoie, K.R. Fowke, J. Kimani, L. McKinnon); University of California–Los Angeles, Los Angeles, California, USA (N.A. Hoff, A.W. Rimoin); Institut National de Recherche Biomédicale, Kinshasa, Democratic Republic of the Congo (P. Mbala-Kingebeni); University of Alberta, Edmonton, Alberta, Canada (R.S. Noyce)

Main Article

Figure

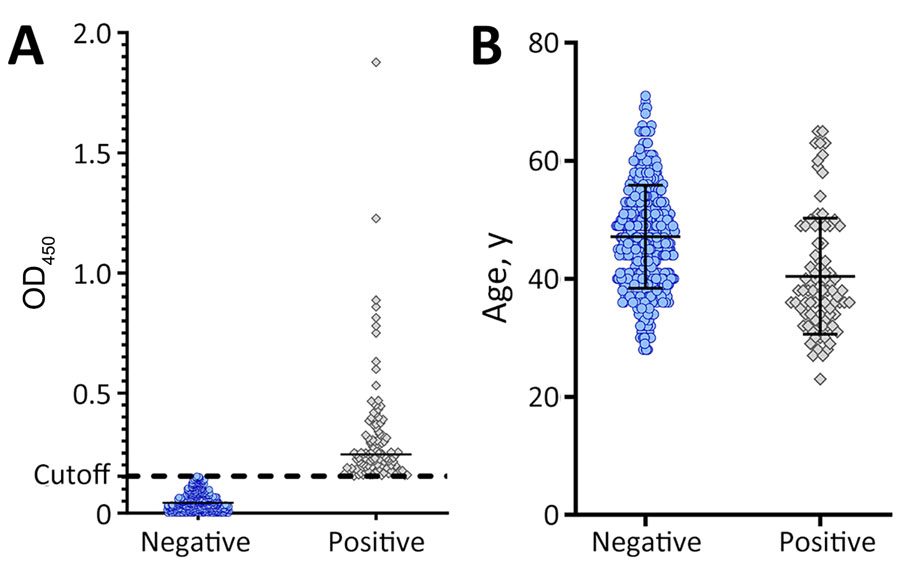
Retrospective assessment of orthopoxvirus antibody seropositivity among key populations, Nairobi, Kenya, 2013–2018. Orthopoxvirus seropositivity was assessed in banked samples acquired from 792 sex workers. A) Seropositivity was determined by ELISA using UV-inactivated vaccinia virus. Cutoff line indicates baseline seropositivity. Positives were determined as 3 SDs above the cutoff. Horizontal bar indicates median. B) Age distribution across all seropositive and seronegative samples. Horizontal bars indicate median with upper quartile above, lower quartile below. OD450, optical density at 450 nm.

Figure. Retrospective assessment of orthopoxvirus antibody seropositivity among key populations, Nairobi, Kenya, 2013–2018. Orthopoxvirus seropositivity was assessed in banked samples acquired from 792 sex workers. A) Seropositivity was determined by ELISA using UV-inactivated vaccinia virus. Cutoff line indicates baseline seropositivity. Positives were determined as 3 SDs above the cutoff. Horizontal bar indicates median. B) Age distribution across all seropositive and seronegative samples. Horizontal bars indicate median with upper quartile above, lower quartile below. OD450, optical density at 450 nm.

Main Article

1These first authors contributed equally to this article.

Page created: July 30, 2024
Page updated: August 21, 2024
Page reviewed: August 21, 2024
The conclusions, findings, and opinions expressed by authors contributing to this journal do not necessarily reflect the official position of the U.S. Department of Health and Human Services, the Public Health Service, the Centers for Disease Control and Prevention, or the authors' affiliated institutions. Use of trade names is for identification only and does not imply endorsement by any of the groups named above.
file_external