Skip directly to site content Skip directly to page options Skip directly to A-Z link Skip directly to A-Z link Skip directly to A-Z link

Disclaimer: Early release articles are not considered as final versions. Any changes will be reflected in the online version in the month the article is officially released.

Volume 31, Number 1—January 2025
Research

Social Contact Patterns in Rural and Urban Settings, Mozambique, 2021–2022

Moses C. Kiti1, Charfudin Sacoor1, Obianuju G. Aguolu, Alana Zelaya, Holin Chen, Sara S. Kim, Nilzio Cavele, Edgar Jamisse, Corssino Tchavana, Americo Jose, Ivalda Macicame, Orvalho Joaquim, Noureen Ahmed, Carol Y. Liu, Inci Yildirim, Kristin Nelson, Samuel M. Jenness, Herberth Maldonado, Momin Kazi, Rajan Srinivasan, Venkata R. Mohan, Alessia Melegaro, Fauzia Malik, Azucena Bardaji, Saad B. Omer2, and Ben Lopman2Comments to Author 
Author affiliation: Emory University, Atlanta, Georgia, USA (M.C. Kiti, A. Zelaya, H. Chen, S.S. Kim, S.M. Jenness, C.Y. Liu, K. Nelson, B. Lopman); Manhica Health Research Center, Manhica, Mozambique (C. Sacoor, E. Jamisse, C. Tchavana, O. Joaquim); Ohio State University, Columbus, Ohio, USA (O.G. Aguolu); Yale University, New Haven, Connecticut, USA (O.G. Aguolu, I. Yilirim); Polana Canico Health and Research Centre, Maputo, Mozambique (N. Cavele, A. Jose, I. Macicame); University of Texas Southwestern Medical Center, Dallas, Texas, USA (N. Ahmed, F. Malik, S.B. Omer); Universidad del Valle de Guatemala, Guatemala City, Guatemala (H. Maldonado); Aga Khan University, Karachi, Pakistan (M. Kazi); Christian Medical College–Vellore, Vellore, India (R. Srinivasan, V.R. Mohan); Bocconi University, Milano, Italy (A. Melegaro); ISGlobal–Barcelona Institute for Global Health, Barcelona, Spain (A. Bardají)

Main Article

Figure 1

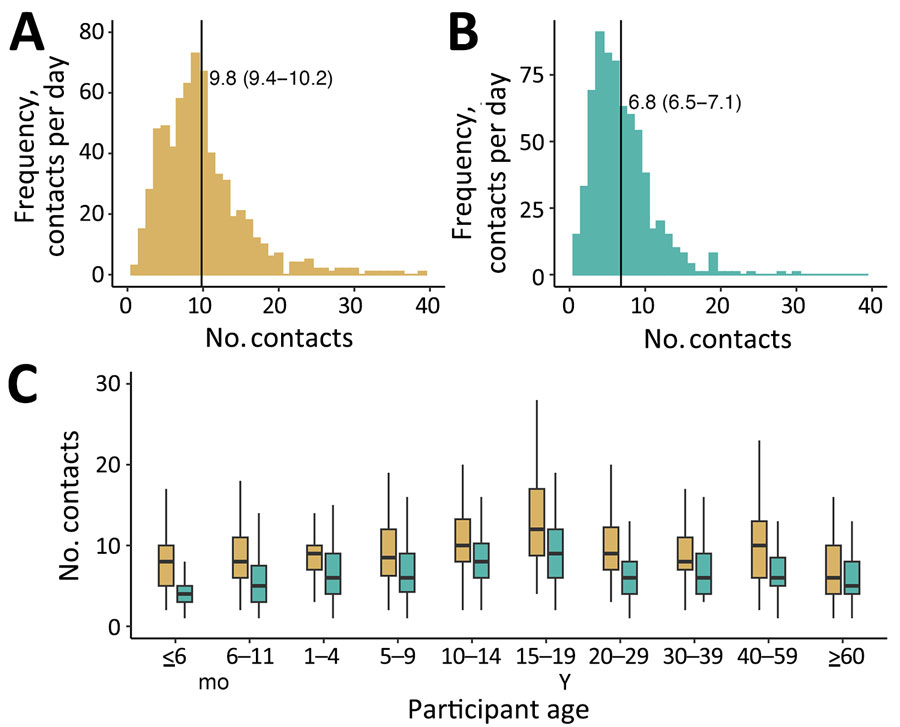
Distribution patterns of number of contacts in rural and urban areas in study of social contact patterns, Mozambique, 2022. A, B) Density distribution of the number of contacts per person in the rural (A) and urban (B) sites. Black vertical lines indicate means; 95% CIs are provided in parentheses. C) Boxplots of the distribution of number of contacts by site (gold, rural; aqua, urban).  Horizontal lines within boxes indicate median number of contacts; top and bottom lines indicate interquartile ranges; error bars indicate 95% CIs.

Figure 1. Distribution patterns of number of contacts in rural and urban areas in study of social contact patterns, Mozambique, 2022. A, B) Density distribution of the number of contacts per person in the rural (A) and urban (B) sites. Black vertical lines indicate means; 95% CIs are provided in parentheses. C) Boxplots of the distribution of number of contacts by site (gold, rural; aqua, urban). Horizontal lines within boxes indicate median number of contacts; top and bottom lines indicate interquartile ranges; error bars indicate 95% CIs.

Main Article

1These first authors contributed equally to this article.

2These authors were co–principal investigators.

Page created: December 02, 2024
Page updated: December 17, 2024
Page reviewed: December 17, 2024
The conclusions, findings, and opinions expressed by authors contributing to this journal do not necessarily reflect the official position of the U.S. Department of Health and Human Services, the Public Health Service, the Centers for Disease Control and Prevention, or the authors' affiliated institutions. Use of trade names is for identification only and does not imply endorsement by any of the groups named above.
file_external