Volume 31, Number 10—October 2025
Research Letter
Increased Rates of Purpureocillium lilacinum Mold among Laboratory Culture Results, United States
Dallas J. Smith , Luisa F. López, Meghan Lyman, Claire Paisley-Jones, and Kaitlin Benedict
Figure
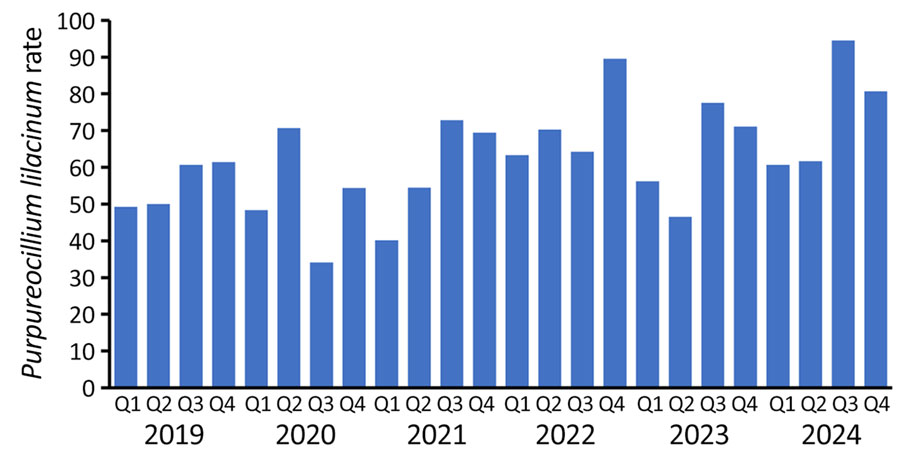
Figure. Rates of Purpureocillium lilacinum mold among laboratory culture results, United States. Graph shows P. lilacinum cultures per 100,000 fungal cultures by year and quarter during March 2019–February 2024.
Page created: September 15, 2025
Page updated: September 25, 2025
Page reviewed: September 25, 2025
The conclusions, findings, and opinions expressed by authors contributing to this journal do not necessarily reflect the official position of the U.S. Department of Health and Human Services, the Public Health Service, the Centers for Disease Control and Prevention, or the authors' affiliated institutions. Use of trade names is for identification only and does not imply endorsement by any of the groups named above.