Skip directly to site content Skip directly to page options Skip directly to A-Z link Skip directly to A-Z link Skip directly to A-Z link

Disclaimer: Early release articles are not considered as final versions. Any changes will be reflected in the online version in the month the article is officially released.

Volume 31, Number 11—November 2025

Synopsis

Trichosporon austroamericanum Infections among Hospitalized Patients, France, 2022–2024

Emilie Burel, Catherine Sartor, Valérie Moal, Vincent Bossi, Jacques Sevestre, Justine Solignac, Rémi Charrel, Marie Desnos-Ollivier, Stéphane Ranque, and Estelle MenuComments to Author 
Author affiliation: Institut Méditerranée-Infection, Marseille, France (E. Burel, V. Bossi); Aix-Marseille Université, Marseille (E. Burel, R. Charrel); Assistance Publique Hôpitaux de Marseille, Hôpital Conception, Marseille (C. Sartor, V. Moal, J. Solignac, R. Charrel); Aix Marseille Université, Institut de Recherche et Développement, Marseille (V. Moal); Aix-Marseille Université, Assistance Publique Hôpitaux de Marseille, Service de Santé des armées, Marseille (J. Sevestre, S. Ranque, E. Menu); Università di Corsica, Corte, France (R. Charrel); Institut Pasteur, Université Paris Cité, National Reference Center for Invasive Mycoses & Antifungals, Paris, France (M. Desnos-Ollivier)

Main Article

Figure 3

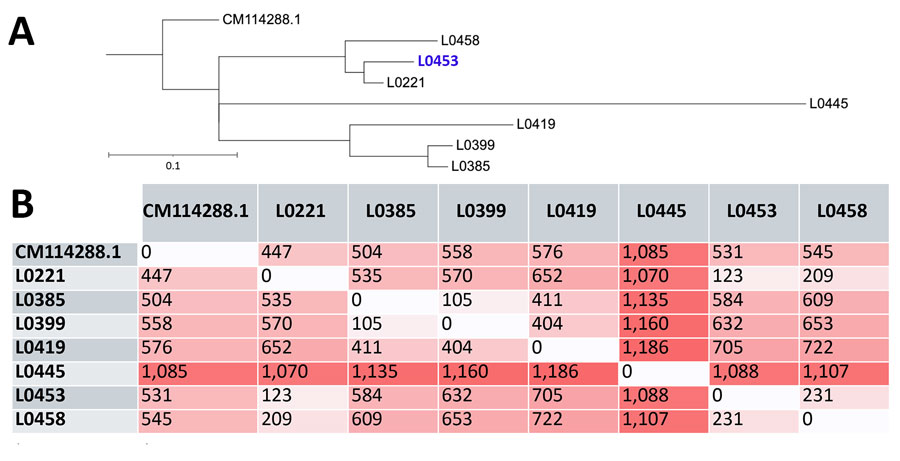
Whole-genome SNP-based phylogeny and distance matrix from study of Trichosporon austroamericanum infections among hospitalized patients, France, 2022–2024. A) Whole-genome phylogenetic tree of the analyzed strains. Blue font indicates reference strain; blue font indicates environmental strain. Scale bar indicates nucleotide substitutions per site. B) Whole-genome SNP distance matrix. Each value represents the number of SNPs that differ between genome pairs. Darker shades indicate greater distance. SNP, single-nucleotide polymorphism.

Figure 3. Whole-genome SNP-based phylogeny and distance matrix from study of Trichosporon austroamericanum infections among hospitalized patients, France, 2022–2024. A) Whole-genome phylogenetic tree of the analyzed strains. Blue font indicates reference strain; blue font indicates environmental strain. Scale bar indicates nucleotide substitutions per site. B) Whole-genome SNP distance matrix. Each value represents the number of SNPs that differ between genome pairs. Darker shades indicate greater distance. SNP, single-nucleotide polymorphism.

Main Article

Page created: September 18, 2025
Page updated: November 20, 2025
Page reviewed: November 20, 2025
The conclusions, findings, and opinions expressed by authors contributing to this journal do not necessarily reflect the official position of the U.S. Department of Health and Human Services, the Public Health Service, the Centers for Disease Control and Prevention, or the authors' affiliated institutions. Use of trade names is for identification only and does not imply endorsement by any of the groups named above.
file_external