Volume 31, Supplement—May 2025
SUPPLEMENT ISSUE
Supplement
Respiratory Virus Detection and Sequencing from SARS-CoV-2–Negative Rapid Antigen Tests
Emmanuela Jules1, Charlie Decker1, Brianna Jeanne Bixler1, Alaa Ahmed, Zijing (Carol) Zhou, Itika Arora, Henok Tafesse, Hannah Dakanay, Andrei Bombin, Ethan Wang, Jessica Ingersoll, Kathy Bifulco, Jennifer K. Frediani, Richard Parsons, Julie Sullivan, Morgan Greenleaf, Jesse J. Waggoner, Greg S. Martin, Wilbur A. Lam, and Anne Piantadosi
Figure 2
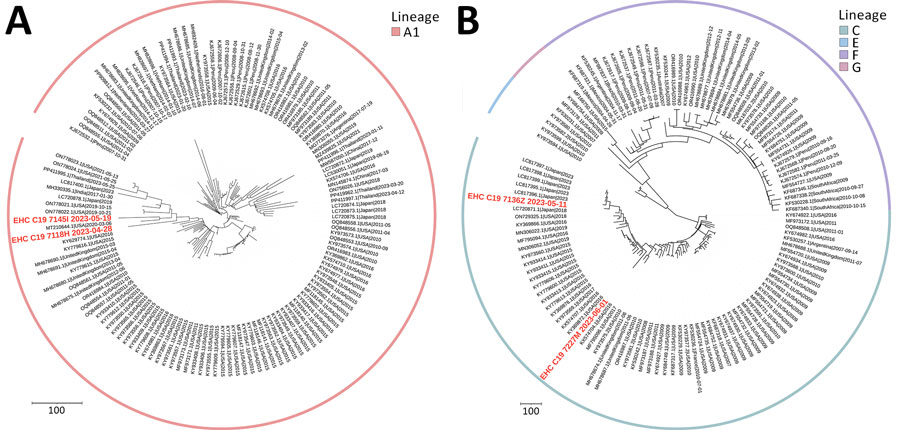
Figure 2. Phylogenetic analysis of parainfluenza 3 virus sequences in study of respiratory virus detection and sequencing from SARS-CoV-2–negative rapid antigen tests. The names of sequences obtained in this study are bold and in red, and reference sequences are in black. The outer ring indicates virus lineage. A) Representative sequences from lineage A1; B) representative sequences from lineages C, E, F, and G. Each tree is a maximized parsimony subtree using downsampled data from the full analysis in Appendix 1 Figure 2), for ease of visualization. GenBank accession numbers are provided for reference sequences. Scale bars indicate number of substitutions per site.
1These first authors contributed equally to this article.
Page created: March 31, 2025
Page updated: May 12, 2025
Page reviewed: May 12, 2025
The conclusions, findings, and opinions expressed by authors contributing to this journal do not necessarily reflect the official position of the U.S. Department of Health and Human Services, the Public Health Service, the Centers for Disease Control and Prevention, or the authors' affiliated institutions. Use of trade names is for identification only and does not imply endorsement by any of the groups named above.