Volume 31, Number 2—February 2025
Research
Epidemiologic and Genomic Surveillance of Vibrio cholerae and Effectiveness of Single-Dose Oral Cholera Vaccine, Democratic Republic of the Congo
Figure 2
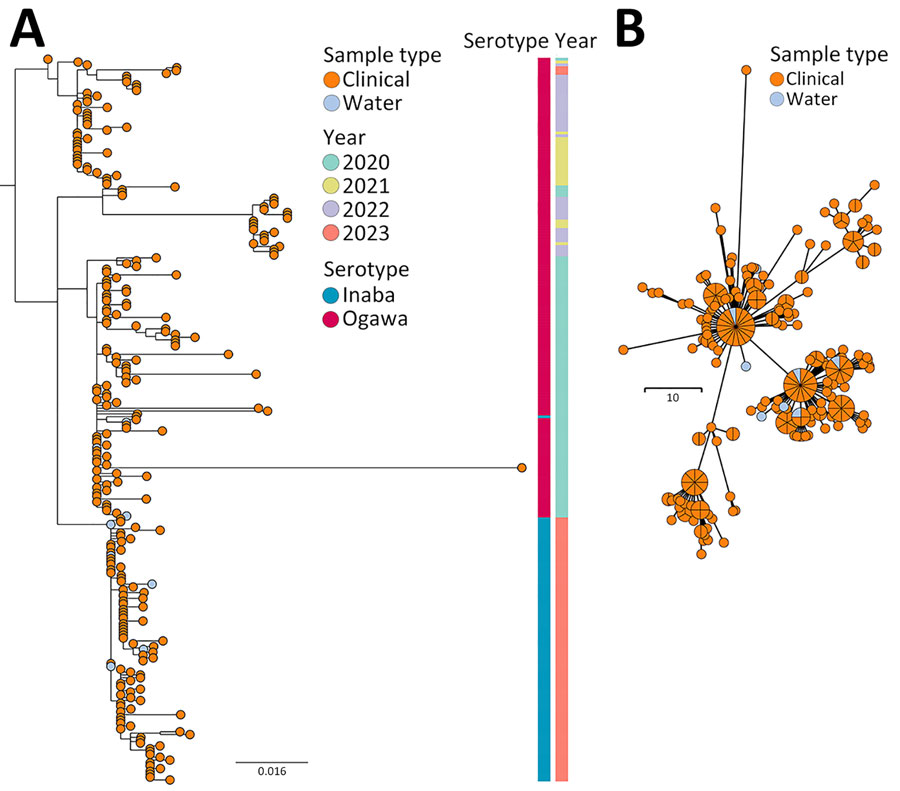
Figure 2. Phylogenetic analysis of Vibrio cholerae seventh pandemic El Tor (7PET) isolates collected during study of V. cholerae transmission and effectiveness of single-dose oral cholera vaccine, Democratic Republic of the Congo. A) Maximum-likelihood tree of 255 7PET V. cholerae genomes sampled in Bukavu during 2020–2023. Node colors indicate sample type. Associated colored metadata indicate sampling year and inferred serotypes according to genome analysis. Scale bar indicates nucleotide substitutions per site. B) Minimum spanning tree of 255 7PET V. cholerae genomes sampled in Bukavu during 2020–2023. Node colors indicate sample type. Isolates with 0 single-nucleotide polymorphism differences between each other are collapsed into single node. Node sizes are scaled according to the number of samples. Scale bar indicates single-nucleotide polymorphisms.
1These first authors contributed equally to this article.