Volume 31, Number 2—February 2025
Research
Epidemiologic and Genomic Surveillance of Vibrio cholerae and Effectiveness of Single-Dose Oral Cholera Vaccine, Democratic Republic of the Congo
Figure 3
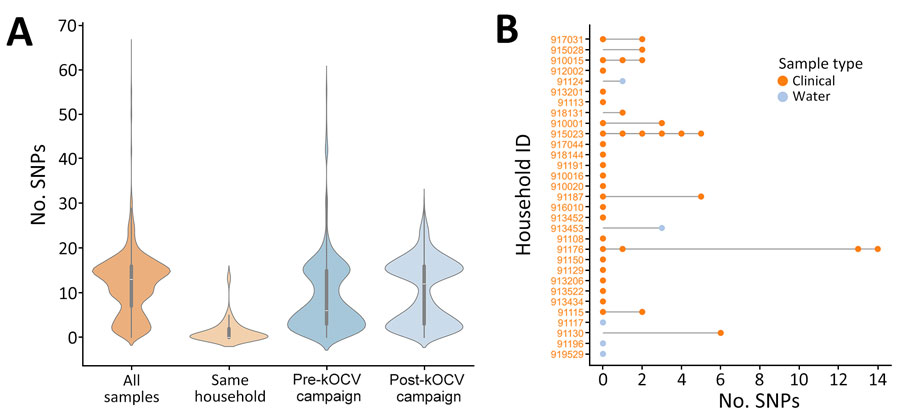
Figure 3. Pairwise comparisons of SNPs in surveillance study of Vibrio cholerae and effectiveness of single-dose killed oral cholera vaccine (kOCV), Democratic Republic of the Congo. A) Violin plot showing distribution of pairwise SNP differences from all isolates collected during the study, those from the same household, and those pre-kOCV and post-kOCV campaign. Density curves indicate frequency of data points. Inside each density plot, horizontal white lines within boxes indicate medians; box tops and bottoms indicate upper (third) and lower (first) quartiles; and whiskers indicate minimum and maximum values. Number of pairwise comparisons for each category is as follows: all samples, n = 32,385; same household, n = 99; pre-kOCV campaign, n = 6,205; and post-kOCV campaign, n = 10,296. B) SNP differences per household. Pairwise SNP differences are relative to the first sample in the household. Node colors indicate sample type; stems connect samples to their household. ID, identification; SNP, single-nucleotide polymorphism.
1These first authors contributed equally to this article.