Volume 31, Number 3—March 2025
Research Letter
Neurosarcocystosis in Patient with HIV-Induced Immunodeficiency
Tonje Skarpengland1, Anders A. Tveita1, Christopher F. Berntsen, Erik. E. Christensen, Magnhild E. Macpherson, Birgitte Stiksrud, Nils O. Hermansen, Pitt Niehusmann, Tine S. Oldereid, Espen Stjernstrøm, Hanne Brekke, Henrik V. Nielsen, and Frank O.D. Pettersen
Figure
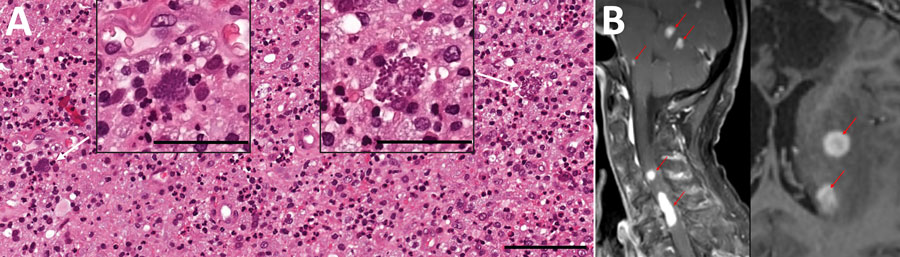
Figure. Microscopic findings and imaging results for patient with HIV-induced immunodeficiency preceding diagnosis of neurosarcocystosis, Norway. A) Light microscopic findings of structures resembling Toxoplasma gondii bradozoites (white arrows) in brain biopsy. Hematoxylin and eosin stain. Scale bars of enlarged images indicate 50 μm; scale bar of background image indicates 100 μm. B) Magnetic resonance imaging of cerebral and spinal cord lesions (contrast enhanced sagtittal T1 sequence, left panel, red arrows) and cerebral lesions with slight peripheral ring enhancement (contrast enhanced transversal T1 sequence, right panel, red arrows).
1These first authors contributed equally to this article.
Page created: December 02, 2024
Page updated: February 28, 2025
Page reviewed: February 28, 2025
The conclusions, findings, and opinions expressed by authors contributing to this journal do not necessarily reflect the official position of the U.S. Department of Health and Human Services, the Public Health Service, the Centers for Disease Control and Prevention, or the authors' affiliated institutions. Use of trade names is for identification only and does not imply endorsement by any of the groups named above.