Skip directly to site content Skip directly to page options Skip directly to A-Z link Skip directly to A-Z link Skip directly to A-Z link

Disclaimer: Early release articles are not considered as final versions. Any changes will be reflected in the online version in the month the article is officially released.

Volume 31, Number 4—April 2025
Research

Predictive Model for Estimating Annual Ebolavirus Spillover Potential

Carson T. TelfordComments to Author , Brian R. Amman, Jonathan S. Towner, Joel M. Montgomery, Justin Lessler, and Trevor Shoemaker
Author affiliation: Centers for Disease Control and Prevention, Atlanta, Georgia, USA (C.T. Telford, B.R. Amman, J.S. Towner, J.M. Montgomery, T. Shoemaker); University of North Carolina, Chapel Hill, North Carolina, USA (C.T. Telford, J. Lessler); Johns Hopkins University, Baltimore, Maryland, USA (J. Lessler)

Main Article

Figure 2

Relative effects of variables in a Zaire ebolavirus–only predictive model for estimating annual Ebolavirus spillover potential. A) Overall variable effects for predicting Ebolavirus spillover likelihood; B) marginal response curves of the relationship between spillover likelihood and each covariate for the top 12 predictors across ensembles of 100 models. Boxes indicate interquartile ranges, horizontal lines within boxes indicate medians, whiskers indicate range values. We measured forest loss in individual covariates for the same year, 1 year prior, and 2 years before spillover events. Mean values for percentage of forest cover, forest loss, forest fragmentation, and human population were extracted surrounding each spillover location using mutually exclusive circular donut buffers with maximum radii of 10, 25, 50, 100, and 150 km.

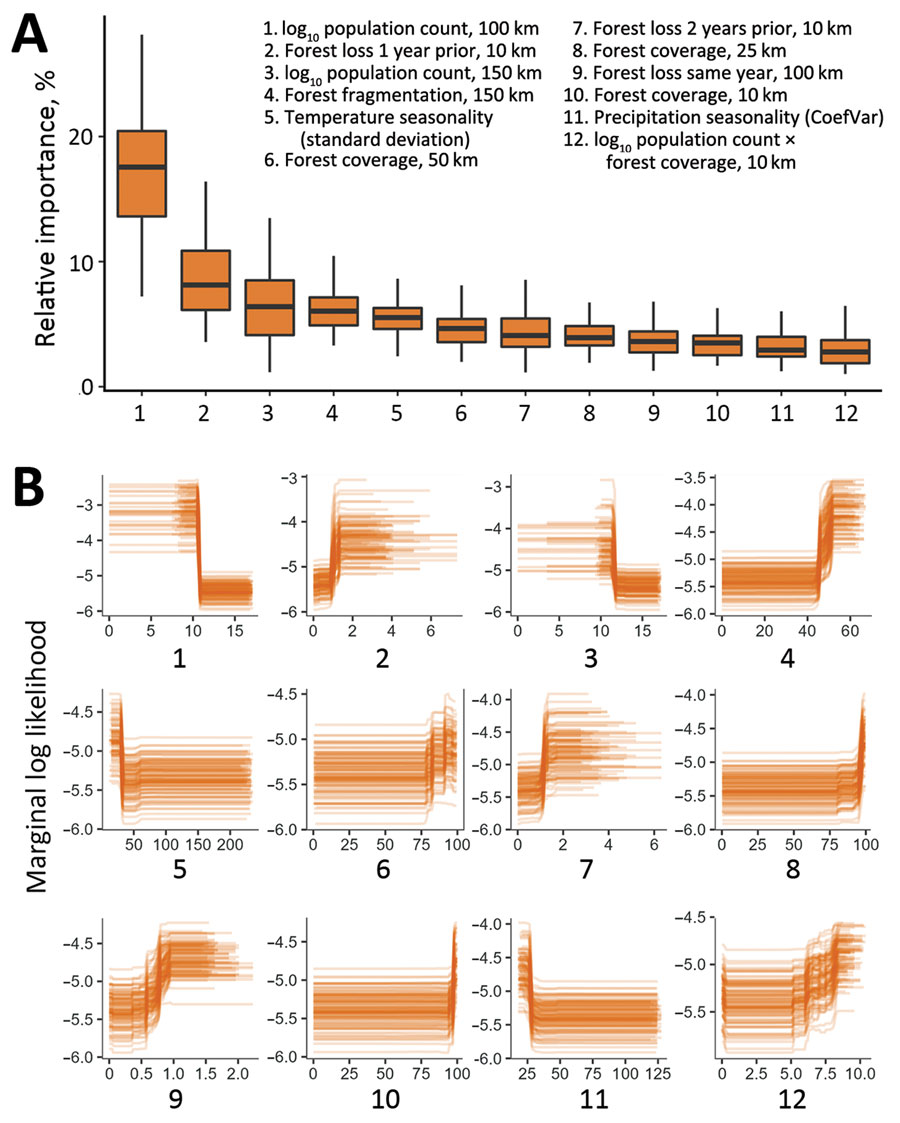
Figure 2. Relative effects of variables in a Zaire ebolavirus–only predictive model for estimating annual Ebolavirus spillover potential. A) Overall variable effects for predicting Ebolavirus spillover likelihood; B) marginal response curves of the relationship between spillover likelihood and each covariate for the top 12 predictors across ensembles of 100 models. Boxes indicate interquartile ranges, horizontal lines within boxes indicate medians, whiskers indicate range values. We measured forest loss in individual covariates for the same year, 1 year prior, and 2 years before spillover events. Mean values for percentage of forest cover, forest loss, forest fragmentation, and human population were extracted surrounding each spillover location using mutually exclusive circular donut buffers with maximum radii of 10, 25, 50, 100, and 150 km.

Main Article

Page created: February 10, 2025
Page updated: March 19, 2025
Page reviewed: March 19, 2025
The conclusions, findings, and opinions expressed by authors contributing to this journal do not necessarily reflect the official position of the U.S. Department of Health and Human Services, the Public Health Service, the Centers for Disease Control and Prevention, or the authors' affiliated institutions. Use of trade names is for identification only and does not imply endorsement by any of the groups named above.
file_external