Volume 31, Number 4—April 2025
Research
Predictive Model for Estimating Annual Ebolavirus Spillover Potential
Carson T. Telford , Brian R. Amman, Jonathan S. Towner, Joel M. Montgomery, Justin Lessler, and Trevor Shoemaker
Figure 4
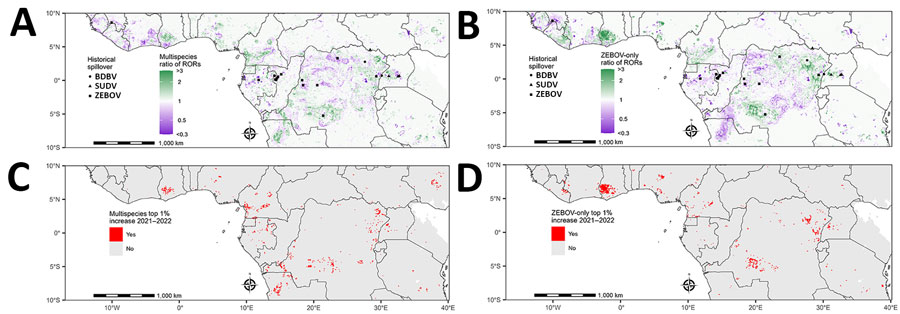
Figure 4. Change in estimated spillover RORs in 2022 compared with 2021 from a predictive model for estimating annual Ebolavirus spillover potential. A, B) Ratio of RORs for spillover in 2022 relative to RORs in 2021 in the multispecies (A) and ZEBOV-only (B) models. C, D) Top 1% ratio of RORs in multispecies (C) and ZEBOV-only (D) models, highlighting top 1% of prediction cells with 1-year increases in spillover ROR estimates from 2021 to 2022. Multispecies model combined BDBV, SUDV, and ZEBOV. RORs were calculated by using the estimated odds of Ebolavirus spillover divided by the average estimate across the entire study area. BDBV, Bundibugyo ebolavirus; ROR, relative odds ratio; SUDV, Sudan ebolavirus; ZEBOV, Zaire ebolavirus.
Page created: February 10, 2025
Page updated: March 24, 2025
Page reviewed: March 24, 2025
The conclusions, findings, and opinions expressed by authors contributing to this journal do not necessarily reflect the official position of the U.S. Department of Health and Human Services, the Public Health Service, the Centers for Disease Control and Prevention, or the authors' affiliated institutions. Use of trade names is for identification only and does not imply endorsement by any of the groups named above.