Surveillance of Viral Respiratory Infections within Maximum-Security Prison, Australia
Nicolas M. Legrand

, Rowena A. Bull, Behzad Hajarizadeh, Andrew R. Lloyd, Kirsty Johnston, Katya Issa, Christine Harvey, Alicia Arnott, Dominic E. Dwyer, Vitali Sintchenko, Luke Grant, Gregory J. Dore, John Kaldor, and Marianne Martinello
Author affiliation: University of New South Wales, Sydney, New South Wales, Australia (N.M. Legrand, R.A. Bull, B. Hajarizadeh, A.R. Lloyd, G.J. Dore, J. Kaldor, M. Martinello); St Vincent’s Correctional Health, Sydney (K. Johnston, K. Issa); New South Wales Ministry of Health, Sydney (C. Harvey); New South Wales Health Pathology, Sydney (A. Arnott, D.E. Dwyer, V. Sintchenko); University of Sydney, Sydney (D.E. Dwyer, V. Sintchenko); Corrective Services New South Wales, Sydney (L. Grant).
Main Article
Figure 2

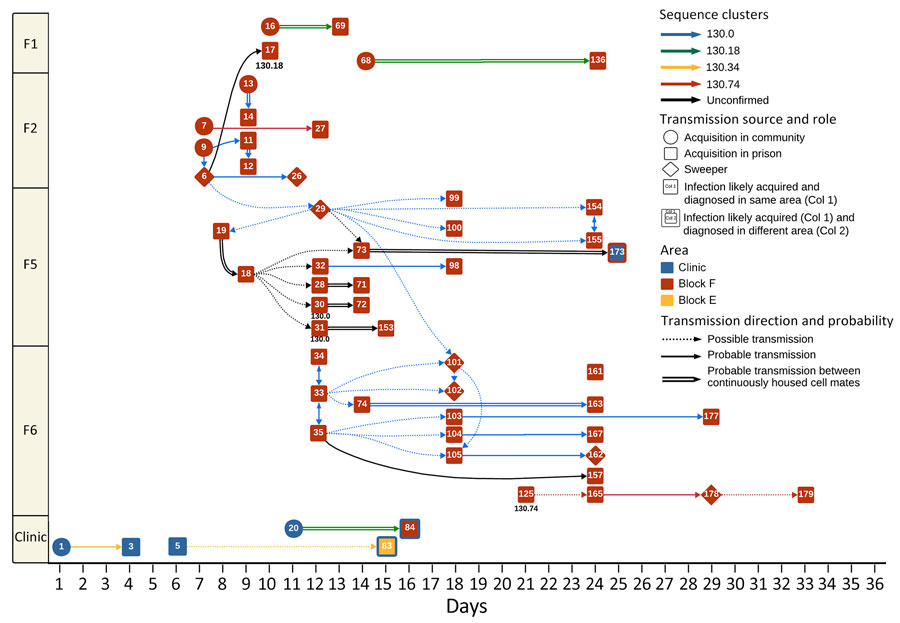
Figure 2. Examples of probable and possible chains of transmission during SARS-CoV-2 outbreak in maximum-security prison in Australia, 2021. Cases are plotted temporally on the basis of infection date and spatially according to both location of infection acquisition and location at the time of diagnosis. Diamonds denote incarcerated persons working as sweepers and circles indicate community-acquired cases. Transmission is visualized with solid lines for probable transmission, dotted lines for possible, and double solid black lines for transmission between cellmates consistently housed together before and after lockdown. Arrowheads mark the likely direction of transmission, and line colors represent genomic sequence clusters. For transmission pathways where only 1 genomic sequence was available, the sequence identification is displayed below the patient.
Main Article
Page created: June 13, 2025
Page updated: July 21, 2025
Page reviewed: July 21, 2025
The conclusions, findings, and opinions expressed by authors contributing to this journal do not necessarily reflect the official position of the U.S. Department of Health and Human Services, the Public Health Service, the Centers for Disease Control and Prevention, or the authors' affiliated institutions. Use of trade names is for identification only and does not imply endorsement by any of the groups named above.
