Skip directly to site content Skip directly to page options Skip directly to A-Z link Skip directly to A-Z link Skip directly to A-Z link

Disclaimer: Early release articles are not considered as final versions. Any changes will be reflected in the online version in the month the article is officially released.

Volume 31, Number 9—September 2025

CME ACTIVITY - Research

Rickettsioses as Underrecognized Cause of Hospitalization for Febrile Illness, Uganda

Paul W. BlairComments to Author , Sultanah Alharthi, Andrés F. Londoño, Abdullah Wailagala, Yukari C. Manabe, J. Stephen Dumler, and the Acute Febrile Illness and Sepsis in Uganda Study Teams1
Author affiliation: Vanderbilt University Medical Center, Nashville, Tennessee, USA (P.W. Blair, S. Alharthi); Uniformed Services University, Bethesda, Maryland, USA (A.F. Londoño, J.S. Dumler); Makerere University, Kampala, Uganda (A. Wailagala); Johns Hopkins University School of Medicine, Baltimore, Maryland, USA (Y.C. Manabe)

Main Article

Figure 1

Alluvial plots of baseline acute serum samples from study of rickettsioses as an underrecognized cause of hospitalization for febrile illness, Uganda. A) Spotted fever group rickettsiae; B) typhus group rickettsiae. Immunofluorescence assay IgG seroprevalence is shown for different sites and different titer cutoffs. Participant samples were from referral hospital clinical study sites in Arua (in yellow; 7.6% of participants), Mubende (in red, 20.6% of participants), and in Fort Portal (in blue, 71.8%). Distribution of the colored lines across the graph shows a comparison of positive or negative samples among the sites. Green is the total percentage of negative samples. Orange is the total percentage of positive samples. Neg, negative; pos, positive.

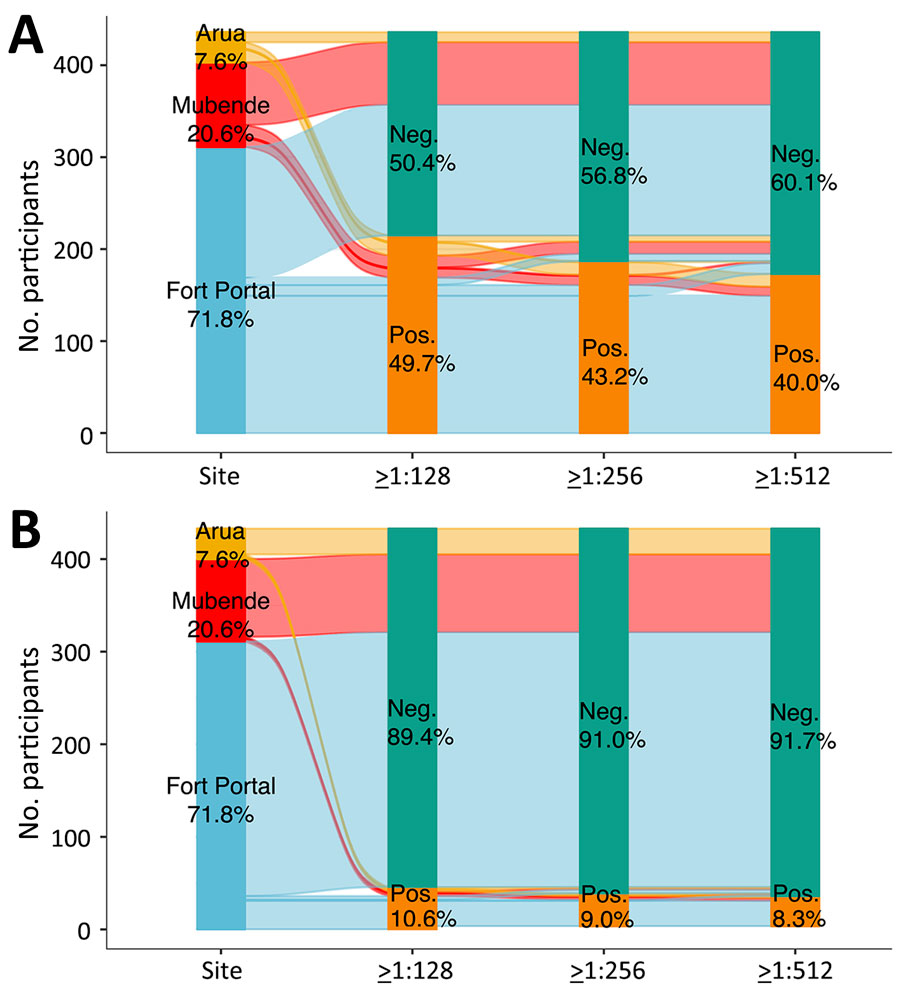
Figure 1. Alluvial plots of baseline acute serum samples from study of rickettsioses as an underrecognized cause of hospitalization for febrile illness, Uganda. A) Spotted fever group rickettsiae; B) typhus group rickettsiae. Immunofluorescence assay IgG seroprevalence is shown for different sites and different titer cutoffs. Participant samples were from referral hospital clinical study sites in Arua (in yellow; 7.6% of participants), Mubende (in red, 20.6% of participants), and in Fort Portal (in blue, 71.8%). Distribution of the colored lines across the graph shows a comparison of positive or negative samples among the sites. Green is the total percentage of negative samples. Orange is the total percentage of positive samples. Neg, negative; pos, positive.

Main Article

1Members are listed at the end of this article.

Page created: July 09, 2025
Page updated: August 22, 2025
Page reviewed: August 22, 2025
The conclusions, findings, and opinions expressed by authors contributing to this journal do not necessarily reflect the official position of the U.S. Department of Health and Human Services, the Public Health Service, the Centers for Disease Control and Prevention, or the authors' affiliated institutions. Use of trade names is for identification only and does not imply endorsement by any of the groups named above.
file_external