Skip directly to site content Skip directly to page options Skip directly to A-Z link Skip directly to A-Z link Skip directly to A-Z link

Disclaimer: Early release articles are not considered as final versions. Any changes will be reflected in the online version in the month the article is officially released.

Volume 32, Number 11—November 2026

Dispatch

Middle East Respiratory Syndrome Coronavirus in Camels, Kazakhstan, 2025

Aidyn Kydyrmanov1Comments to Author , Yermukhammet Kassymbekov, Sardor Nuralibekov, Temirlan Sabyrzhan, Yelizaveta Khan, Marat Kumar, Aigerim Abdimadiyeva, and Kobey Karamendin1
Author affiliation: Research and Production Center for Microbiology and Virology, Almaty, Kazakhstan

Main Article

Figure 1

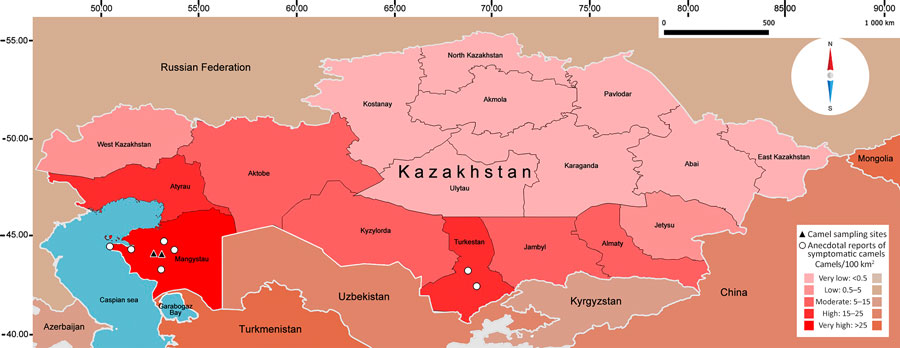
Choropleth representation of camel density used in a study of Middle East respiratory syndrome coronavirus camels, Kazakhstan, 2025. Camel sampling sites and areas with anecdotal reports of symptomatic camels are shown. Colors indicate animals/100 km2 in Kazakhstan and surrounding countries. All spatial data processing, density calculations, and map visualization were conducted by using QGIS (version 3.40.12, https://qgis.org). All spatial data were projected in by using the World Geodetic System 1984 (EPSG:4326). Map design displays geographic coordinates so that equal angular intervals of longitude and latitude are represented uniformly, despite corresponding to different ground distances, producing an elongation of the study area.

Figure 1. Choropleth representation of camel density used in a study of Middle East respiratory syndrome coronavirus camels, Kazakhstan, 2025. Camel sampling sites and areas with anecdotal reports of symptomatic camels are shown. Colors indicate animals/100 km2 in Kazakhstan and surrounding countries. All spatial data processing, density calculations, and map visualization were conducted by using QGIS (version 3.40.12, https://qgis.org). All spatial data were projected in by using the World Geodetic System 1984 (EPSG:4326). Map design displays geographic coordinates so that equal angular intervals of longitude and latitude are represented uniformly, despite corresponding to different ground distances, producing an elongation of the study area.

Main Article

1These authors contributed equally to this work and share first and last authorship.

Page created: August 17, 2026
Page updated: October 16, 2026
Page reviewed: October 16, 2026
The conclusions, findings, and opinions expressed by authors contributing to this journal do not necessarily reflect the official position of the U.S. Department of Health and Human Services, the Public Health Service, the Centers for Disease Control and Prevention, or the authors' affiliated institutions. Use of trade names is for identification only and does not imply endorsement by any of the groups named above.
file_external