Volume 32, Number 4—April 2026
Research Letter
Seroepidemiologic Study of Oropouche Virus, Amazonas State, Brazil, 2015–2016
Figure 2
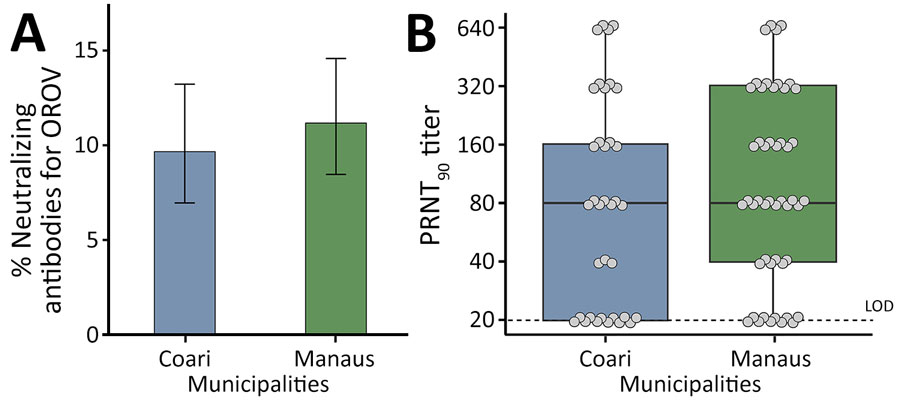
Figure 2. Serosurvey of Oropouche virus in Coari and Manaus municipalities, Amazonas state, Brazil, 2015–2016. A) Percentage of serum samples positive for neutralizing antibodies for OROV per municipality. Error bars indicate 95% CIs. B) Box plot showing the distribution of PRNT90 titers of serum samples by municipality. Solid black horizontal line represents the median, box upper and lower limits represent the 75th and 25th percentiles, and whiskers represent minimum and maximum values. Dashed line represents LOD. Dots represent individual healthy volunteers. LOD, limit of detection; NAb, neutralizing antibodies; OROV, Oropouche virus; PRNT90, 90% plaque reduction neutralization test.
1These authors contributed equally to this article.
2These senior authors contributed equally to this article.