Skip directly to site content Skip directly to page options Skip directly to A-Z link Skip directly to A-Z link Skip directly to A-Z link

Disclaimer: Early release articles are not considered as final versions. Any changes will be reflected in the online version in the month the article is officially released.

Volume 32, Number 4—April 2026

Research

Accelerated Increase in Candida auris Bloodstream Infections during COVID-19 Pandemic, South Africa

Husna Ismail, Olga Perovic, Ruth Mpembe, Warren Lowman, Chetna Govind, Pieter Ekermans, Waasila Jassat, Richard Welch, and Nelesh P. GovenderComments to Author 
Author affiliation: National Institute for Communicable Diseases, a Division of the National Health Laboratory Service, Johannesburg, South Africa (H. Ismail, O. Perovic, R. Mpembe, W. Jassat, R. Welch, N.P. Govender); University of the Witwatersrand, Johannesburg, South Africa (R. Mpembe, W. Lowman, N.P. Govender); Vermaak and Partners/Pathcare Pathologists, Pretoria, South Africa (W. Lowman); Wits Donald Gordon Medical Centre, Johannesburg (W. Lowman); Lancet Laboratories, Durban, South Africa (C. Govind); Ampath Microbiology National Reference Laboratory, Centurion, South Africa (P. Ekermans)

Main Article

Figure 5

Effects of the COVID-19 pandemic on weekly Candida BSI counts in study of accelerated increase in C. auris BSIs during COVID-19 pandemic, South Africa, January 2019–June 2022. Vertical dashed red line marks the onset of the COVID-19 pandemic in South Africa (March 5, 2020). Solid green line represents the ITS model prediction for Candida BSIs; solid blue line indicates the actual number of Candida BSIs. Weekly COVID-19 case counts are scaled (dotted red line) and overlaid for comparison. Background shading indicates timing and duration of national lockdown alert levels: level 5, March 27–April 30, 2020; level 4, May 1–May 31, 2020; level 3, June 1–August 17, 2020; level 2, August 18–September 20, 2020; level 1, September 21–December 28, 2020. BSI, bloodstream infection; ITS, interrupted time series.

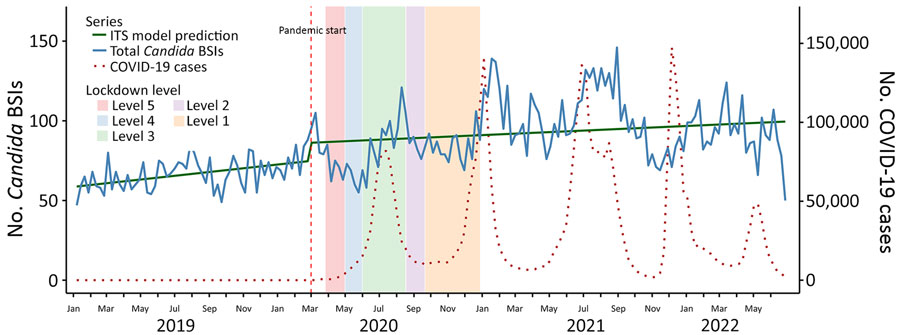
Figure 5. Effects of the COVID-19 pandemic on weekly Candida BSI counts in study of accelerated increase in C. auris BSIs during COVID-19 pandemic, South Africa, January 2019–June 2022. Vertical dashed red line marks the onset of the COVID-19 pandemic in South Africa (March 5, 2020). Solid green line represents the ITS model prediction for Candida BSIs; solid blue line indicates the actual number of Candida BSIs. Weekly COVID-19 case counts are scaled (dotted red line) and overlaid for comparison. Background shading indicates timing and duration of national lockdown alert levels: level 5, March 27–April 30, 2020; level 4, May 1–May 31, 2020; level 3, June 1–August 17, 2020; level 2, August 18–September 20, 2020; level 1, September 21–December 28, 2020. BSI, bloodstream infection; ITS, interrupted time series.

Main Article

Page created: February 07, 2026
Page updated: April 02, 2026
Page reviewed: April 02, 2026
The conclusions, findings, and opinions expressed by authors contributing to this journal do not necessarily reflect the official position of the U.S. Department of Health and Human Services, the Public Health Service, the Centers for Disease Control and Prevention, or the authors' affiliated institutions. Use of trade names is for identification only and does not imply endorsement by any of the groups named above.
file_external