Skip directly to site content Skip directly to page options Skip directly to A-Z link Skip directly to A-Z link Skip directly to A-Z link

Disclaimer: Early release articles are not considered as final versions. Any changes will be reflected in the online version in the month the article is officially released.

Volume 32, Number 5—May 2026

Research Letter

Serial Interval and Intervention Efficiency in Pertussis Outbreak, South Korea, 2024

Andrei R. AkhmetzhanovComments to Author , Bianca de Padua, and Jonathan Dushoff
Author affiliation: College of Public Health, National Taiwan University, Taipei, Taiwan (A.R. Akhmetzhanov, B. de Padua); McMaster University, Hamilton, Ontario, Canada (J. Dushoff)

Main Article

Figure 2

Temporal variation in the forward-looking reproduction number and the mean generation time across the outbreak period of a school-based pertussis outbreak in South Korea in 2024. A) Graph of the forward-looking reproduction number, defined as the average number of secondary infections generated by a case infected on a given date, accounting for interventions throughout their infectious period. B) Graph of the mean generation time, defined as the average interval between the infection of a primary case and the infections they cause. Vertical dashed line indicates the start of the main intervention (2024 Apr 17). Solid lines represent posterior means; light and dark shaded areas indicate 95% and 50% (interquartile) credible intervals.

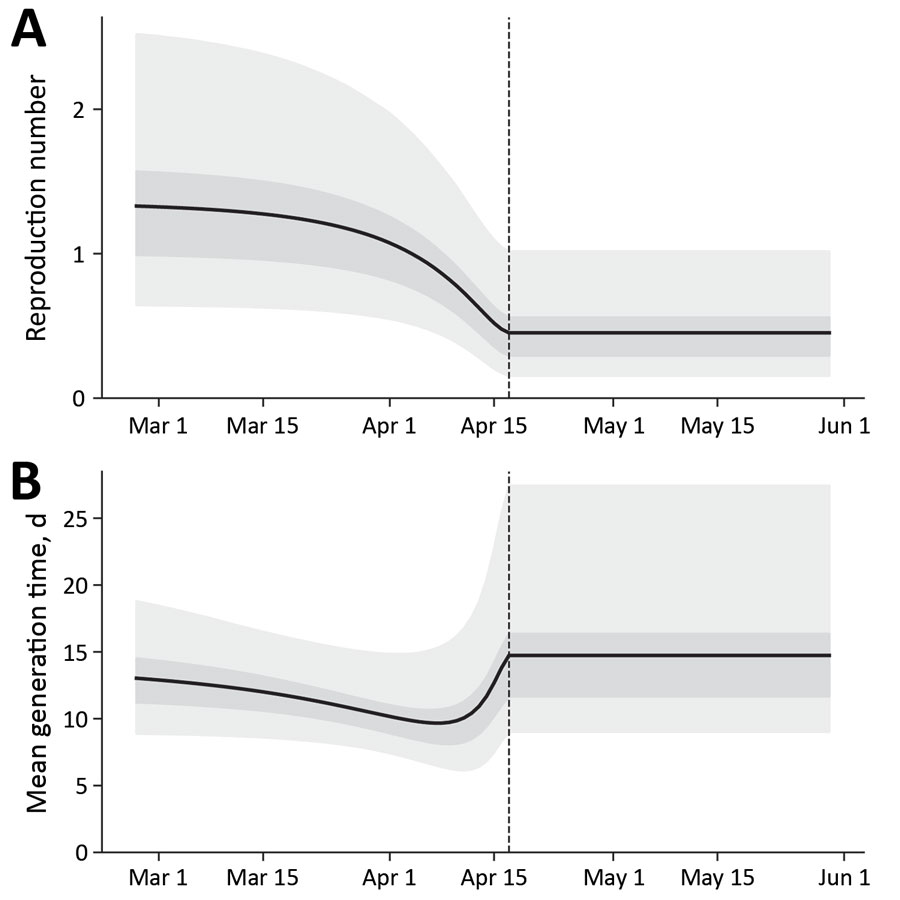
Figure 2. Temporal variation in the forward-looking reproduction number and the mean generation time across the outbreak period of a school-based pertussis outbreak in South Korea in 2024. A) Graph of the forward-looking reproduction number, defined as the average number of secondary infections generated by a case infected on a given date, accounting for interventions throughout their infectious period. B) Graph of the mean generation time, defined as the average interval between the infection of a primary case and the infections they cause. Vertical dashed line indicates the start of the main intervention (2024 Apr 17). Solid lines represent posterior means; light and dark shaded areas indicate 95% and 50% (interquartile) credible intervals.

Main Article

Page created: April 02, 2026
Page updated: April 29, 2026
Page reviewed: April 29, 2026
The conclusions, findings, and opinions expressed by authors contributing to this journal do not necessarily reflect the official position of the U.S. Department of Health and Human Services, the Public Health Service, the Centers for Disease Control and Prevention, or the authors' affiliated institutions. Use of trade names is for identification only and does not imply endorsement by any of the groups named above.
file_external