Skip directly to site content Skip directly to page options Skip directly to A-Z link Skip directly to A-Z link Skip directly to A-Z link

Volume 32, Number 5—May 2026

CME ACTIVITY - Research

Frequency and Duration of Diagnostic Delays Associated with Coccidioidomycosis and Risk Factors for Missed Diagnoses, United States

Desmond D. Barber, Alan T. Arakkal, George R. Thompson, John W. Baddley, Joe E. Cavanaugh, Aaron C. Miller, and Philip M. PolgreenComments to Author 
Author affiliation: University of Iowa College of Medicine, Iowa City, Iowa, USA (D.D. Barber, A.T. Arakkal, J.E. Cavanaugh, A.C. Miller, P.M. Polgreen); University of California, Davis, California, USA (G.R. Thompson); Johns Hopkins University, Baltimore, Maryland, USA (J.W. Baddley)

Main Article

Figure 1

Trends in SSD-related healthcare visits in the 365 days before index coccidioidomycosis diagnosis in study of frequency and duration of diagnostic delays associated with coccidioidomycosis and risk factors for missed diagnoses, United States. A) Raw SSD visit counts for each day before the index coccidioidomycosis diagnosis. B) Expected trendline (in red) estimated from visits between 92–365 days before the index coccidioidomycosis diagnosis; vertical blue line indicates start of the diagnostic opportunity window, beginning 91 days before the index diagnosis. Estimated number of missed diagnostic opportunities is depicted as the area between the observed line (in black) and the expected trend (in red) during the diagnostic opportunity window (region to the right of the blue line). SSD, symptomatically similar diagnosis.

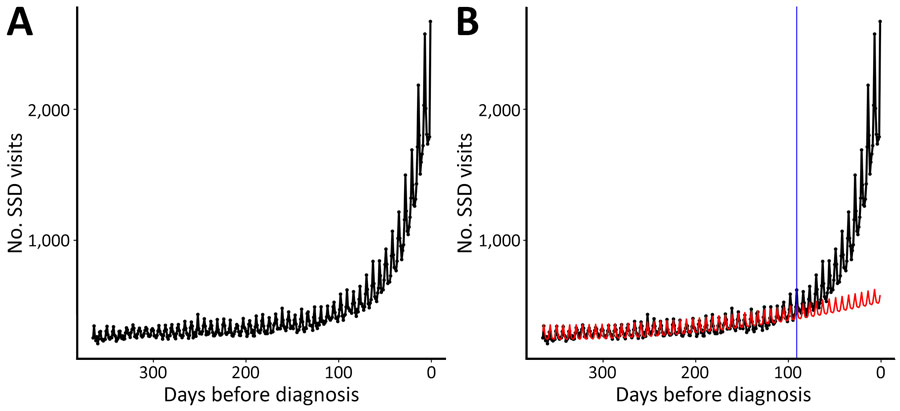
Figure 1. Trends in SSD-related healthcare visits in the 365 days before index coccidioidomycosis diagnosis in study of frequency and duration of diagnostic delays associated with coccidioidomycosis and risk factors for missed diagnoses, United States. A) Raw SSD visit counts for each day before the index coccidioidomycosis diagnosis. B) Expected trendline (in red) estimated from visits between 92–365 days before the index coccidioidomycosis diagnosis; vertical blue line indicates start of the diagnostic opportunity window, beginning 91 days before the index diagnosis. Estimated number of missed diagnostic opportunities is depicted as the area between the observed line (in black) and the expected trend (in red) during the diagnostic opportunity window (region to the right of the blue line). SSD, symptomatically similar diagnosis.

Main Article

Page created: March 23, 2026
Page updated: May 11, 2026
Page reviewed: May 11, 2026
The conclusions, findings, and opinions expressed by authors contributing to this journal do not necessarily reflect the official position of the U.S. Department of Health and Human Services, the Public Health Service, the Centers for Disease Control and Prevention, or the authors' affiliated institutions. Use of trade names is for identification only and does not imply endorsement by any of the groups named above.
file_external