Volume 9, Number 12—December 2003
Research
Global Distribution of Rubella Virus Genotypes
Du-Ping Zheng*1, Teryl K. Frey* , Joseph P. Icenogle†, Shigetaka Katow†‡, Emily S. Abernathy*†, Ki-Joon Song§, Wen-Bo Xu¶, Vitaly Yarulin#, R.G. Desjatskova#, Yair Aboudy**, Gisela Enders††, and Margaret Croxson‡‡
Figure 2
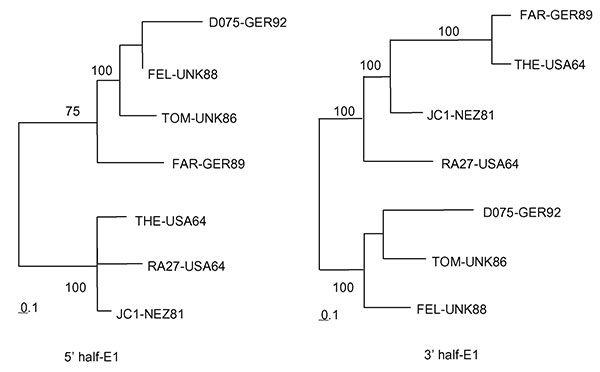
Figure 2. Phylogenetic trees. Trees were made by the maximum likelihood method in the Tree-Puzzle 5.0 program (1,000 puzzling steps) using the 5′ half (640 nt: 8291–8930) or 3′ half (539 nt: 8931–9469) of the E1 gene sequence. Bootstrapping values (out of 100) for each node are given.
1Current address: Respiratory and Enteric Viruses Branch, Division of Viral and Rickettsial Diseases, National Center for Infectious Diseases, Centers for Disease Control and Prevention, Atlanta, GA, USA.
Page created: February 09, 2011
Page updated: February 09, 2011
Page reviewed: February 09, 2011
The conclusions, findings, and opinions expressed by authors contributing to this journal do not necessarily reflect the official position of the U.S. Department of Health and Human Services, the Public Health Service, the Centers for Disease Control and Prevention, or the authors' affiliated institutions. Use of trade names is for identification only and does not imply endorsement by any of the groups named above.