Volume 9, Number 12—December 2003
Research
Global Distribution of Rubella Virus Genotypes
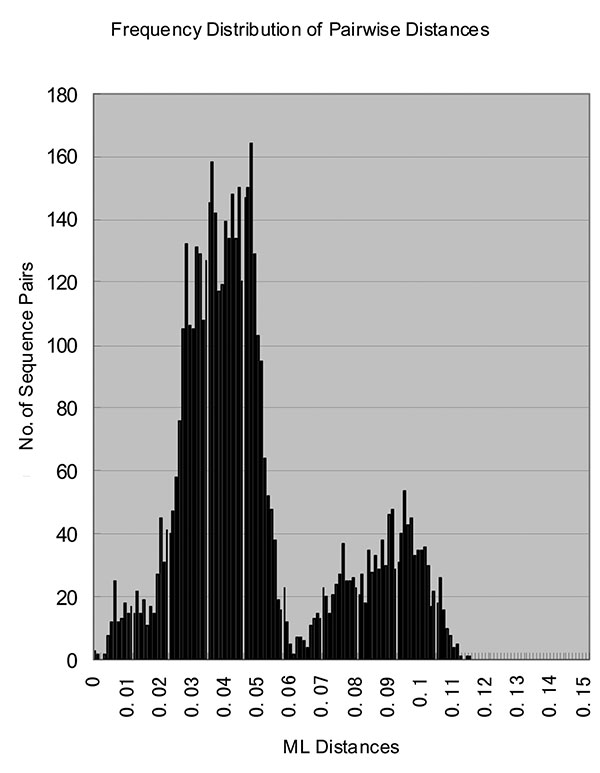
Figure 3

Figure 3. Histogram of genetic distances between rubella virus sequences. The histogram, showing the distribution of all of the pairwise distances between the rubella virus sequences in the study, was constructed from the maximum likelihood distance matrix computed by Tree Puzzle 5.0 program.
1Current address: Respiratory and Enteric Viruses Branch, Division of Viral and Rickettsial Diseases, National Center for Infectious Diseases, Centers for Disease Control and Prevention, Atlanta, GA, USA.
Page created: February 09, 2011
Page updated: February 09, 2011
Page reviewed: February 09, 2011
The conclusions, findings, and opinions expressed by authors contributing to this journal do not necessarily reflect the official position of the U.S. Department of Health and Human Services, the Public Health Service, the Centers for Disease Control and Prevention, or the authors' affiliated institutions. Use of trade names is for identification only and does not imply endorsement by any of the groups named above.