Volume 9, Number 5—May 2003
Research
Seasonal Patterns of Invasive Pneumococcal Disease
Scott F. Dowell*† , Cynthia G. Whitney†, Carolyn Wright†, Charles E. Rose†, and Anne Schuchat†
Figure 5
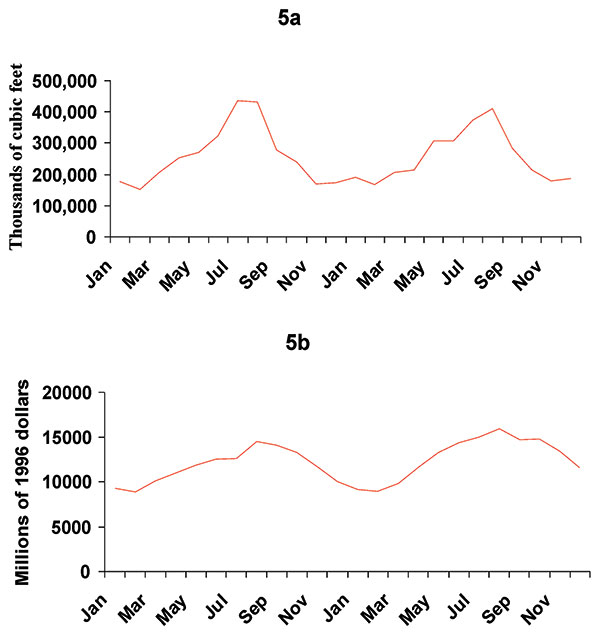
Figure 5. Seasonal variations in U.S. electric utility gas consumption (a) and public construction expenditures (b). Both parameters correlated indirectly with the invasive pneumococcal disease rates (gas consumption: r –0.92 with a 22-month lag; and construction: r –0.84 with a 35-month lag). Data were obtained from the Energy Information Administration and the U.S. Census Bureau, respectively.
Page created: December 08, 2010
Page updated: December 08, 2010
Page reviewed: December 08, 2010
The conclusions, findings, and opinions expressed by authors contributing to this journal do not necessarily reflect the official position of the U.S. Department of Health and Human Services, the Public Health Service, the Centers for Disease Control and Prevention, or the authors' affiliated institutions. Use of trade names is for identification only and does not imply endorsement by any of the groups named above.