Volume 9, Number 5—May 2003
Research
Seasonal Patterns of Invasive Pneumococcal Disease
Scott F. Dowell*† , Cynthia G. Whitney†, Carolyn Wright†, Charles E. Rose†, and Anne Schuchat†
Figure 2
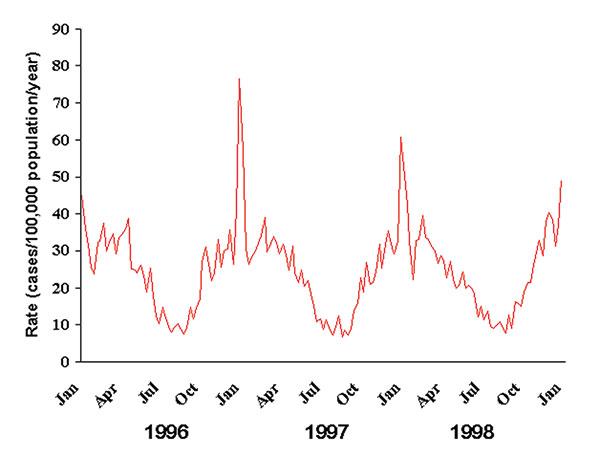
Figure 2. Weekly rates of invasive pneumococcal disease in the United States, January 1996–December 1998. Weekly numbers of cases from active surveillance areas in California, Connecticut, Georgia, Maryland, Minnesota, Oregon, and Tennessee were divided by the population under surveillance that year and multiplied by 52 to give annualized weekly rates.
Page created: December 08, 2010
Page updated: December 08, 2010
Page reviewed: December 08, 2010
The conclusions, findings, and opinions expressed by authors contributing to this journal do not necessarily reflect the official position of the U.S. Department of Health and Human Services, the Public Health Service, the Centers for Disease Control and Prevention, or the authors' affiliated institutions. Use of trade names is for identification only and does not imply endorsement by any of the groups named above.