Volume 10, Number 9—September 2004
Research
Silent Nucleotide Polymorphisms and a Phylogeny for Mycobacterium tuberculosis
Figure 1
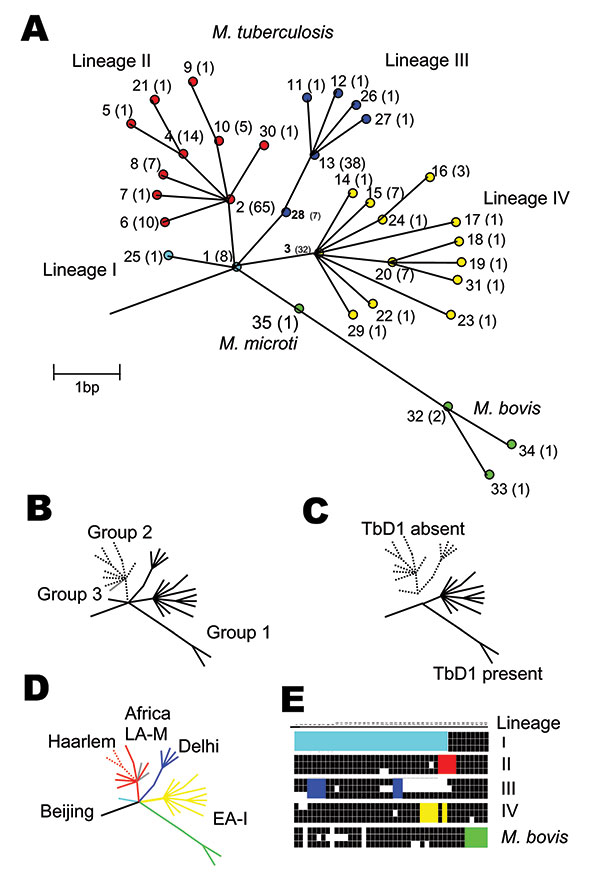
Figure 1. Unifying phylogeny for Mycobacterium tuberculosis. A) Maximum parsimony tree of M. tuberculosis and M. bovis based on 37 silent single-nucleotide polymorphisms in 225 isolates. Synonymous sequence types (SST) are marked 1–35. The frequency of each SST is marked in parentheses. The nodes of the major lineages are highlighted: lineage I (cyan), lineage II (red), lineage III (blue), lineage IV (yellow), and M. bovis (green). The colors correspond to those in Figure 2. Note both M. africanum Type I isolates sequenced were SST 1. B) Schematic representation of the genetic groups 1, 2, and 3 defined by the katG-gyrA scheme. C) Schematic representation of the presence or absence of the tuberculosis specific region of difference, TbD1. D) Schematic representation of the strain families Beijing, Haarlem, Africa, Delhi, East Africa-India (EA-I), and Latin America-Mediterranean (LA-M), previously described by IS6110 restriction fragment length polymorphism typing and spoligotyping, demonstrating concordance with the phylogenetic tree. E) Spoligotyping patterns for representative isolates of each lineage demonstrating lack of probe hybridization at spacers 1–34 in lineage I, 33–36 in lineage II, 4–7 and 23–24 in lineage III, 29–32 and 34 in lineage IV, and 39–43 in M. bovis.