Volume 13, Number 4—April 2007
Dispatch
Bluetongue in Belgium, 2006
Jean-François Toussaint*, Corinne Sailleau†, Jan Mast*, Philippe Houdart‡, Guy Czaplicki§, Lien Demeestere*, Frank Vandenbussche*, Wesley van Dessel*, Nesya Goris*, Emmanuel Bréard†, Lotfi Bounaadja†, Etienne Thiry¶, Stephan Zientara†, and Kris De Clercq*
Figure 2
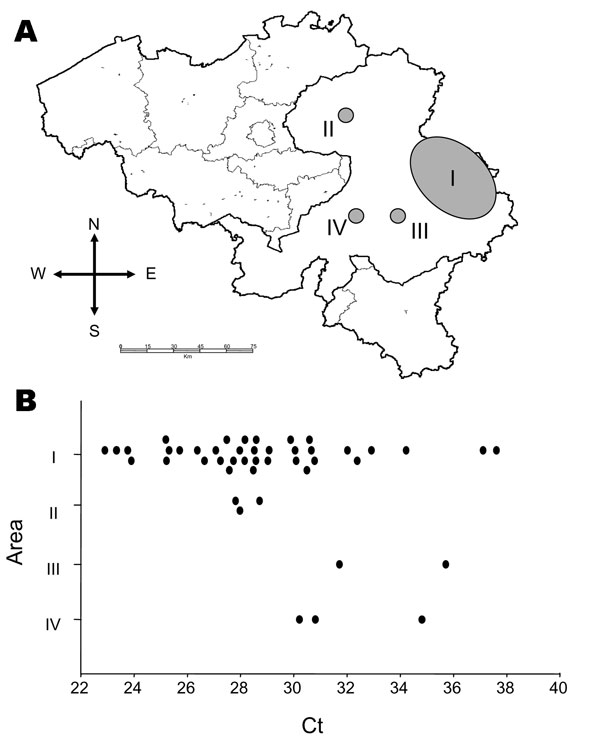
Figure 2. A) Distribution of outbreaks of bluetongue (shaded areas) reported in Belgium from August 18 through September 14, 2006. Area I is where the disease was initially detected. B) Cycle threshold (Ct) values observed in different zones as a result of conducting reverse transcription–quantitative PCR_S5 on individual blood samples.
Page created: June 28, 2010
Page updated: June 28, 2010
Page reviewed: June 28, 2010
The conclusions, findings, and opinions expressed by authors contributing to this journal do not necessarily reflect the official position of the U.S. Department of Health and Human Services, the Public Health Service, the Centers for Disease Control and Prevention, or the authors' affiliated institutions. Use of trade names is for identification only and does not imply endorsement by any of the groups named above.