Volume 13, Number 6—June 2007
Research
Antimicrobial Drug–Resistant Escherichia coli from Humans and Poultry Products, Minnesota and Wisconsin, 2002–2004
Figure 1
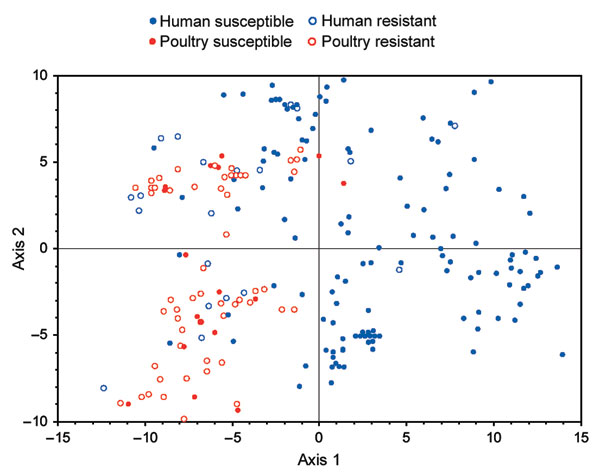
Figure 1. Principal coordinates analysis of distribution of 243 extraintestinal pathogenic Escherichia coli isolates from human feces and poultry products, Minnesota and Wisconsin, 2002–2004, on the axis 1–axis 2 plane. Data include extended virulence genotypes (60 traits) and phylogenetic group (A, B1, B2, D). The axes have no units; they reflect the total score for each isolate derived by summing the isolate's partial score for each variable, which is the product of the loading score assigned to the particular variable for a given axis and the isolate's status for that variable. Axis 1 (positive values to right, negative values to left of central vertical line) accounted for 37% of total variance and showed significant differences between susceptible human isolates versus each of the other groups. Axis 2 (positive values above, negative values below central horizontal line) accounted for 20% of total variance and did not show any significant between-group differences. Resistant, resistant to trimethoprim-sulfamethoxazole, nalidixic acid (quinolones), and ceftriaxone or ceftazidime (extended-spectrum cephalosporins). Susceptible, susceptible to all these agents (regardless of other possible drug resistance).