Volume 13, Number 6—June 2007
Research
Bovine Spongiform Encephalopathy and Spatial Analysis of the Feed Industry
Mathilde Paul*, David Abrial*, Nathalie Jarrige†, Stéphane Rican‡, Myriam Garrido*, Didier Calavas†, and Christian Ducrot*
Figure 4
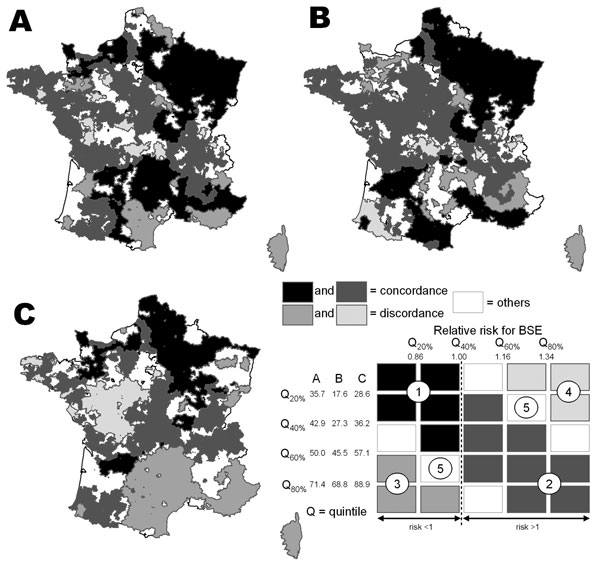
Figure 4. Mapping of the crude link between the relative risk for bovine spongiform encephalopathy (BSE) and the exposure to meat-and-bone meal (A), animal fat (B), and animal dicalcium phosphate (C). In the left part of the key are the limits of the quintiles for each type of exposure (expressed in percent of factories using the byproduct). In the rest of the key, for each type of exposure, groups 1 and 2 represent a concordant relationship between the relative risk for BSE and each type of exposure (high exposure with relative risk for BSE >1, and low exposure with relative risk for BSE <1); groups 3 and 4 represent a discordant relationship (high exposure with relative risk <1 and the contrary); group 5 is intermediate.
Page created: May 31, 2011
Page updated: May 31, 2011
Page reviewed: May 31, 2011
The conclusions, findings, and opinions expressed by authors contributing to this journal do not necessarily reflect the official position of the U.S. Department of Health and Human Services, the Public Health Service, the Centers for Disease Control and Prevention, or the authors' affiliated institutions. Use of trade names is for identification only and does not imply endorsement by any of the groups named above.