Volume 13, Number 9—September 2007
Research
Frequent Travelers and Rate of Spread of Epidemics
Appendix Figure 1
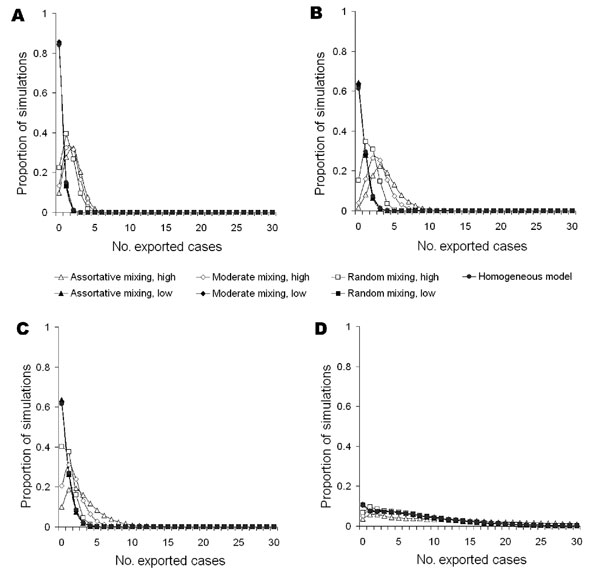
Appendix Figure 1. Truncated distribution (50,000 runs) of number of cases exported from a single simulated source epidemic for severe acute respiratory syndrome–like parameters (A and B) and influenza-like parameters (C and D) (50,000 runs, parameters are listed in Table 1) on day 10 (A and C) and day 20 (B and D) after introduction of the first cases. Results are shown for a population in which everyone travels equally frequently, (homogeneous model, circles), for a population in which 1% travels 20 times more frequently than the rest of the population, and for the 2 populations mixed randomly (φ = 1, squares) for moderate levels of mixing between the groups (φ = 0.5, diamonds) and for low levels of mixing, in which most contacts are assortative (φ = 0.25, triangles). The first cases are either in the majority population of low-frequency fliers (solid symbols) or the high-frequency fliers (open symbols).