Volume 14, Number 1—January 2008
Research
Experimental Infection of Swans and Geese with Highly Pathogenic Avian Influenza Virus (H5N1) of Asian Lineage
Figure 2
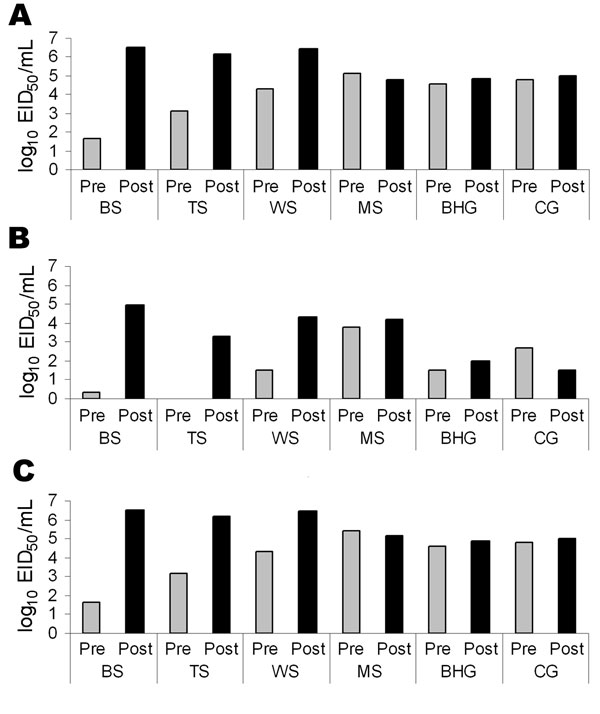
Figure 2. The average concentration of viral shedding in oropharyngeal (A), cloacal (B), and combined (C) routes before (pre) and after (post) the onset of clinical signs in 4 species of swans and 2 species of geese exposed to highly pathogenic avian influenza virus (H5N1) by intranasal inoculation or contact with infected birds. Viral concentrations were determined by adding viral titers before and after the onset of clinical signs for each individual bird and then using these values to calculate a pre- and postclinical average for each species. The single bar-headed goose that did not shed detectable concentrations of virus in the feces was included in the calculation of the averages for this species. EID50, median embryo infectious dose; BS, black swans; TS, trumpeter swans; WS, whooper swans; MS, mute swans; BHG, bar-headed geese; CG, cackling geese.