Volume 14, Number 10—October 2008
Research
Ecologic Factors Associated with West Nile Virus Transmission, Northeastern United States
Heidi E. Brown1, James E. Childs, Maria A. Diuk-Wasser, and Durland Fish
Figure 1
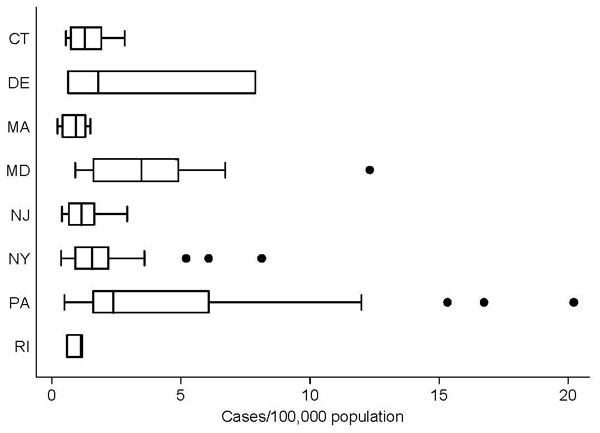
Figure 1. Box plot of total incidence of West Nile virus disease in humans, by county, for the 8 northeastern states in the study area (CT, Connecticut; DE, Delaware; MA, Massachusetts; MD, Maryland; NJ, New Jersey; NY, New York; PA, Pennsylvania; RI, Rhode Island). The box plot provides the median, lower, and upper quartiles; the standard deviation; and any data outliers. This plot excludes those counties that did not report cases. The outliers tend to be the few cases that occurred in areas with low populations.
Page created: July 13, 2010
Page updated: July 13, 2010
Page reviewed: July 13, 2010
The conclusions, findings, and opinions expressed by authors contributing to this journal do not necessarily reflect the official position of the U.S. Department of Health and Human Services, the Public Health Service, the Centers for Disease Control and Prevention, or the authors' affiliated institutions. Use of trade names is for identification only and does not imply endorsement by any of the groups named above.