Volume 14, Number 10—October 2008
Research
Ecologic Factors Associated with West Nile Virus Transmission, Northeastern United States
Heidi E. Brown1, James E. Childs, Maria A. Diuk-Wasser, and Durland Fish
Figure 3
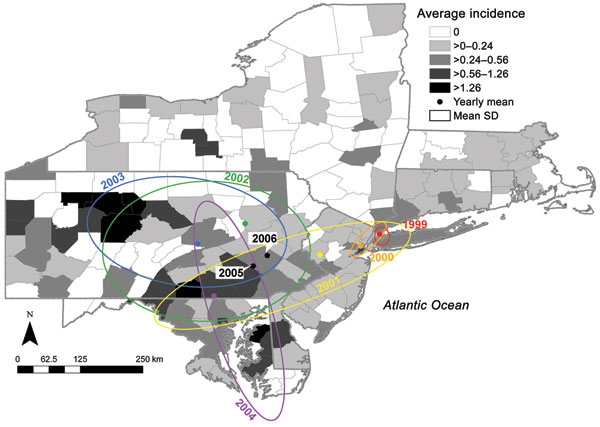
Figure 3. Incidence of human West Nile virus disease cases in 8 northeastern states, 1999–2006. Deviation ellipses indicate 1 SD of the geographic mean yearly incidence calculated as the incidence weighted average in space for each county. Incidence is attributed to the county centroid. This graph shows the urban concentration along the Eastern Seaboard as well as the outliers in western Pennsylvania (1 case in counties with low populations). The 2005 and 2006 regression of the geographic mean incidence is also depicted.
Page created: July 13, 2010
Page updated: July 13, 2010
Page reviewed: July 13, 2010
The conclusions, findings, and opinions expressed by authors contributing to this journal do not necessarily reflect the official position of the U.S. Department of Health and Human Services, the Public Health Service, the Centers for Disease Control and Prevention, or the authors' affiliated institutions. Use of trade names is for identification only and does not imply endorsement by any of the groups named above.