Volume 14, Number 5—May 2008
Research
Efficacy of Aerial Spraying of Mosquito Adulticide in Reducing Incidence of West Nile Virus, California, 2005
Figure 4
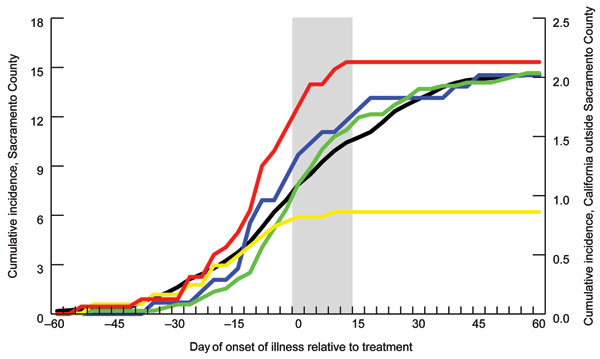
Figure 4. Cumulative incidence of human cases of West Nile virus (WNV) in Sacramento County and California, 2005. Only cases with known date of onset of illness and location information (i.e., Sacramento County at the address level and California at the county level) are included in the analysis. Cumulative incidence is the total no. WNV cases/100,000 population. Green line shows incidence within untreated area; red line shows incidence within northern treated area; yellow line shows incidence within southern treated area; blue line shows incidence within northern and southern buffer zones combined; black line shows incidence within, California excluding Sacramento County. Values along the x-axis (days) are grouped into sets of 3 and labeled with the date farthest from 0. Each of the 3 days of adulticiding within the treated areas and buffer zones was considered to be 0; for the untreated area and the rest of California, the dates of the northern adulticiding (August 8–10) were considered to be 0. The wide gray vertical band represents time from the first day of treatment to the maximum range of the human WNV incubation period 14 days later.