Volume 5, Number 6—December 1999
Research
Epidemiologic Studies of Cyclospora cayetanensis in Guatemala
Caryn Bern*† , Beatriz Hernandez†, Maria Beatriz Lopez†, Michael J. Arrowood*, Maricruz Alvarez de Mejia†, Ana Maria de Merida†, Allen W. Hightower*, Linda Venczel‡, Barbara L. Herwaldt*, and Robert E. Klein†
Figure
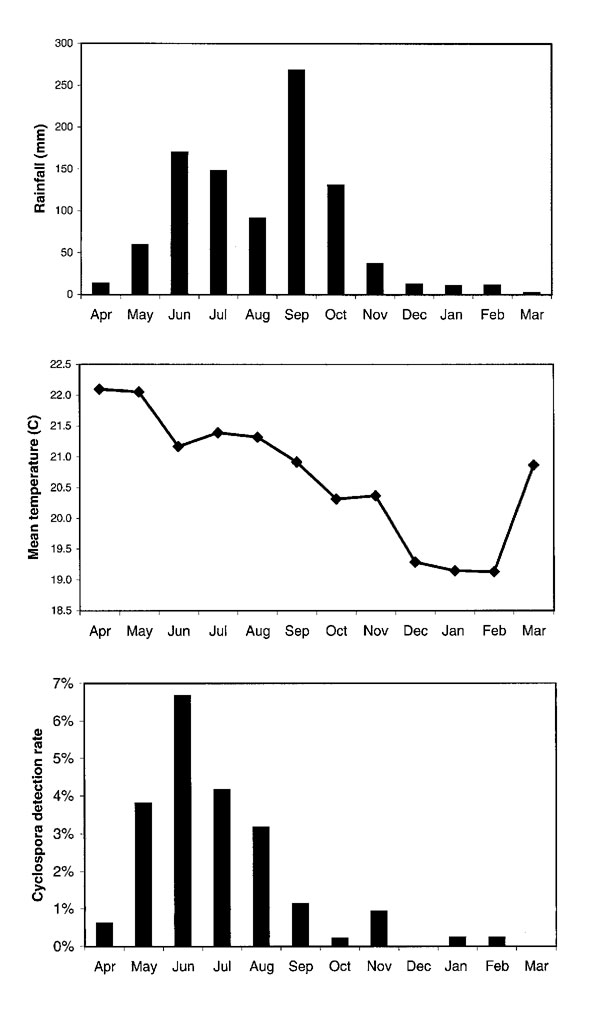
Figure. Surveillance for Cyclospora cayetanensis infection in stool specimens from three hospital outpatient departments and two health centers in Guatemala, April 6, 1997, to March 19, 1998. From the bottom, the three graphs demonstrate the Cyclospora detection rate, mean temperature in centigrade, and rainfall in mm by month. Median number of specimens per month 444 (324-638).
Page created: December 15, 2010
Page updated: December 15, 2010
Page reviewed: December 15, 2010
The conclusions, findings, and opinions expressed by authors contributing to this journal do not necessarily reflect the official position of the U.S. Department of Health and Human Services, the Public Health Service, the Centers for Disease Control and Prevention, or the authors' affiliated institutions. Use of trade names is for identification only and does not imply endorsement by any of the groups named above.