Volume 9, Number 5—May 2003
Research
Seasonal Patterns of Invasive Pneumococcal Disease
Figure 3
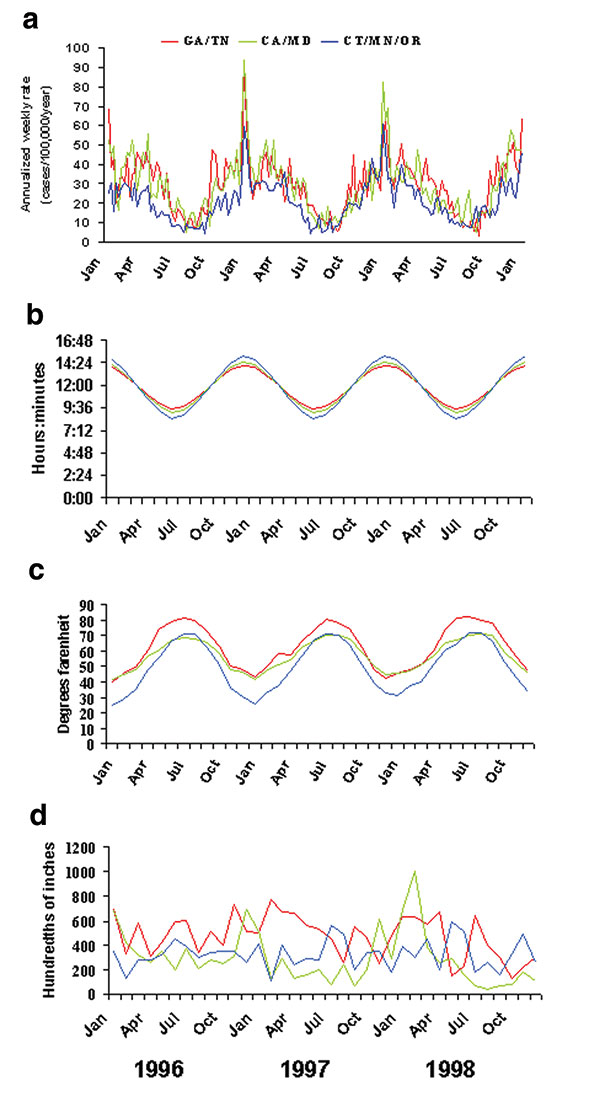
Figure 3. The relationship of invasive pneumococcal disease to photoperiod, temperature, and precipitation in three surveillance areas, grouped by latitude, 1996–1998. Southern surveillance areas were in Georgia and Tennessee (red lines; 33°–35° north latitude), middle areas were in California and Maryland (green lines; 37°–39° north latitude), and northern areas were in Connecticut, Minnesota, and Oregon (blue lines; 41°–45° north latitude). a: Rates of invasive pneumococcal disease; b: hours of darkness calculated for the 15th day of each month; c: mean monthly surface air temperature recorded at weather stations in each of the seven surveillance sites. d: total monthly precipitation recorded at weather stations in each of the seven surveillance sites. Pneumococcal disease correlated directly with photoperiod (r 0.85 with a 5-week lag; p<0.0001), indirectly with temperature (r –0.82 with a 1-week lag; p<0.0001), and poorly with precipitation (r 0 to <0.3).