Volume 10, Number 11—November 2004
Research
Evaluating Human Papillomavirus Vaccination Programs
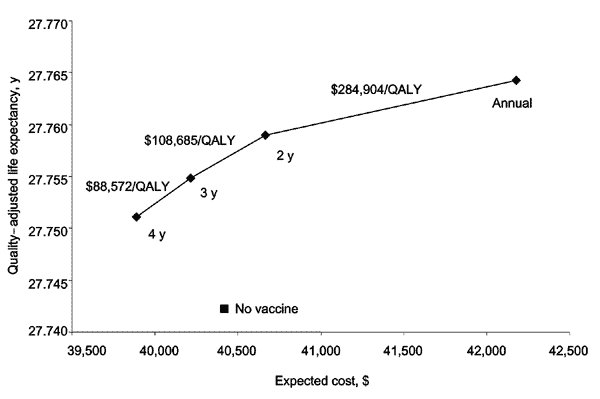
Figure 3

Figure 3. . Effect of changing frequency with which vaccinated women receive a Pap test. The diamonds represent Pap testing annually, every 2 years (base case), every 3 years, and every 4 years. The x-axis represents the lifetime expected cost of the vaccination strategy; the y-axis is the quality-adjusted life expectancy in years. The incremental cost-effectiveness of increasing the frequency of Pap testing for vaccinated women is indicated numerically above the cost-effectiveness frontier. QALY, quality-adjusted life-year.
Page created: April 17, 2012
Page updated: April 17, 2012
Page reviewed: April 17, 2012
The conclusions, findings, and opinions expressed by authors contributing to this journal do not necessarily reflect the official position of the U.S. Department of Health and Human Services, the Public Health Service, the Centers for Disease Control and Prevention, or the authors' affiliated institutions. Use of trade names is for identification only and does not imply endorsement by any of the groups named above.