Volume 10, Number 4—April 2004
Research
Epidemiologic Determinants for Modeling Pneumonic Plague Outbreaks
Raymond Gani* and Steve Leach*
Figure 6
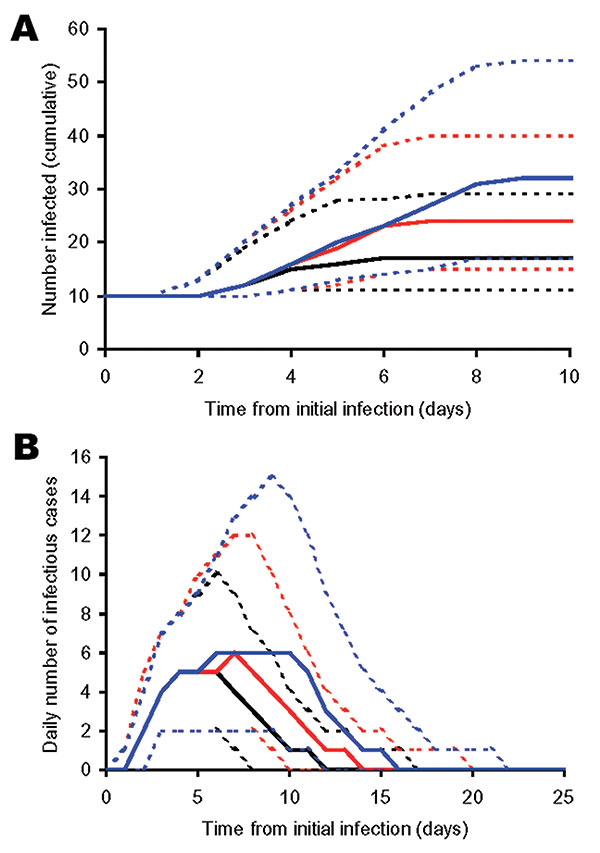
Figure 6. Estimates for (A) the cumulative number of people infected from the time of the first infection, and (B) daily number of infected people, where D0 = 1 (black), 5 (red) and 10 (blue). Solid lines represent the median number of cases from multiple iterations (n = 1000) of the model and the dotted lines give the upper and lower 95 percentiles.
Page created: February 09, 2011
Page updated: February 09, 2011
Page reviewed: February 09, 2011
The conclusions, findings, and opinions expressed by authors contributing to this journal do not necessarily reflect the official position of the U.S. Department of Health and Human Services, the Public Health Service, the Centers for Disease Control and Prevention, or the authors' affiliated institutions. Use of trade names is for identification only and does not imply endorsement by any of the groups named above.