Volume 10, Number 4—April 2004
Research
Epidemiologic Determinants for Modeling Pneumonic Plague Outbreaks
Raymond Gani* and Steve Leach*
Figure 7
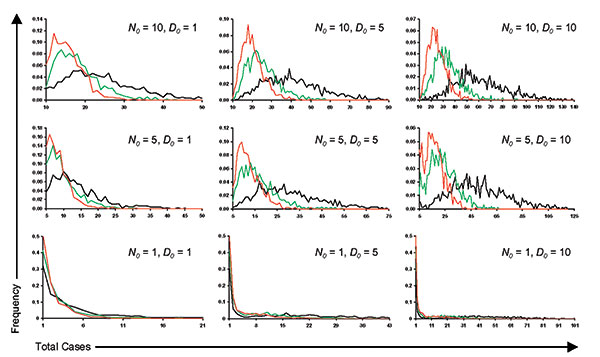
Figure 7. Variation in the expected number of cases at the end of an outbreak when N0, D0, and R0 are varied across multiple iterations (n = 27,000) of the model (red denotes R0 = 0.96, green denotes R0 = 1.3, and black denotes R0 = 2.3). (N.B. Note scale changes).
Page created: February 09, 2011
Page updated: February 09, 2011
Page reviewed: February 09, 2011
The conclusions, findings, and opinions expressed by authors contributing to this journal do not necessarily reflect the official position of the U.S. Department of Health and Human Services, the Public Health Service, the Centers for Disease Control and Prevention, or the authors' affiliated institutions. Use of trade names is for identification only and does not imply endorsement by any of the groups named above.