Volume 10, Number 7—July 2004
Research
Model Parameters and Outbreak Control for SARS
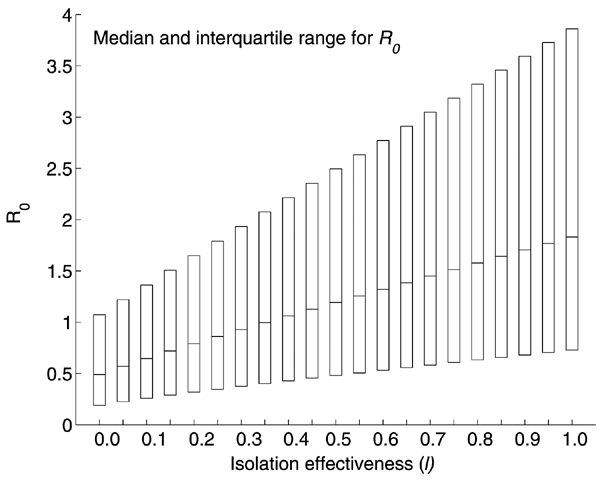
Figure 4

Figure 4. . Boxplot of the sensitivity of R0 estimates to varying values of l, the relative infectiousness after isolation has begun. l = 0 denotes perfect isolation while l = 1 denotes no isolation. The boxplot shows the median and the interquartile range of R0 obtained from Monte Carlo sampling of size 105.
1At the time this work was carried out, Dr. Castillo-Chavez was on sabbatical at Los Alamos National Laboratory and faculty of Cornell University.
2Recall that l = 0 corresponds to complete isolation, whereas l = 1 means no effective isolation occurs. Hence, a decrease in l means an increase in the effective isolation of the infected persons.
Page created: April 23, 2012
Page updated: April 23, 2012
Page reviewed: April 23, 2012
The conclusions, findings, and opinions expressed by authors contributing to this journal do not necessarily reflect the official position of the U.S. Department of Health and Human Services, the Public Health Service, the Centers for Disease Control and Prevention, or the authors' affiliated institutions. Use of trade names is for identification only and does not imply endorsement by any of the groups named above.