Volume 10, Number 7—July 2004
Research
Alert Threshold Algorithms and Malaria Epidemic Detection
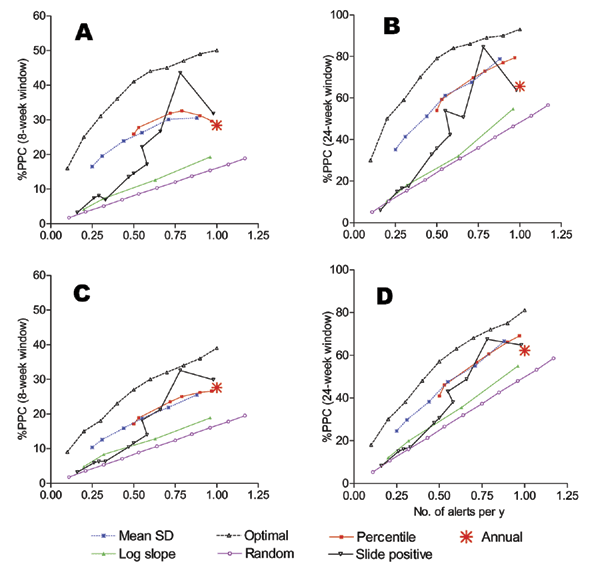
Figure 2

Figure 2. Percent of potentially preventable cases (PPC) by number of alerts per year for different algorithms. (A) and (B) were obtained from cases in excess of the weekly mean with window of effectiveness of 8 and 24 weeks, respectively. (C) and (D) were obtained from cases in excess of the weekly mean minus one SD for window of 8 and 24 weeks, respectively. The scale of y-axis is higher for (B) and (D) because they are based on 24 weeks of PPC (based on the random alert, the %PPC for the 24-week window is three times that of the 8-week window of effectiveness).
Page created: November 07, 2011
Page updated: November 07, 2011
Page reviewed: November 07, 2011
The conclusions, findings, and opinions expressed by authors contributing to this journal do not necessarily reflect the official position of the U.S. Department of Health and Human Services, the Public Health Service, the Centers for Disease Control and Prevention, or the authors' affiliated institutions. Use of trade names is for identification only and does not imply endorsement by any of the groups named above.