Volume 10, Number 7—July 2004
Research
Alert Threshold Algorithms and Malaria Epidemic Detection
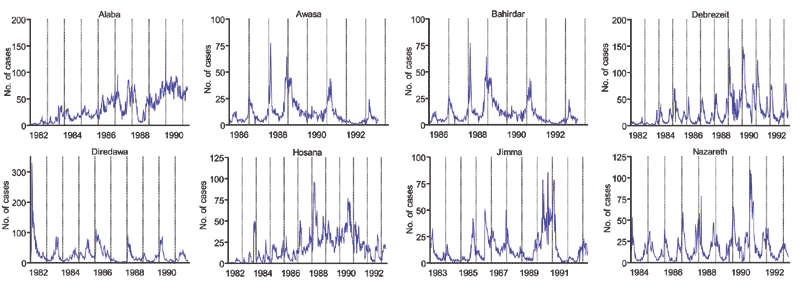
Figure A1

Figure A1. Time series of normalized weekly average daily malaria cases for 10 districts. Years are according to the Ethiopian calendar, in which year y begins on September 11 of year y+7 in the Western calendar.
Page created: November 07, 2011
Page updated: November 07, 2011
Page reviewed: November 07, 2011
The conclusions, findings, and opinions expressed by authors contributing to this journal do not necessarily reflect the official position of the U.S. Department of Health and Human Services, the Public Health Service, the Centers for Disease Control and Prevention, or the authors' affiliated institutions. Use of trade names is for identification only and does not imply endorsement by any of the groups named above.