Volume 10, Number 9—September 2004
Perspective
Potential Public Health Impact of New Tuberculosis Vaccines
Elad Ziv*, Charles L. Daley*†, and Sally Blower‡
Figure 2
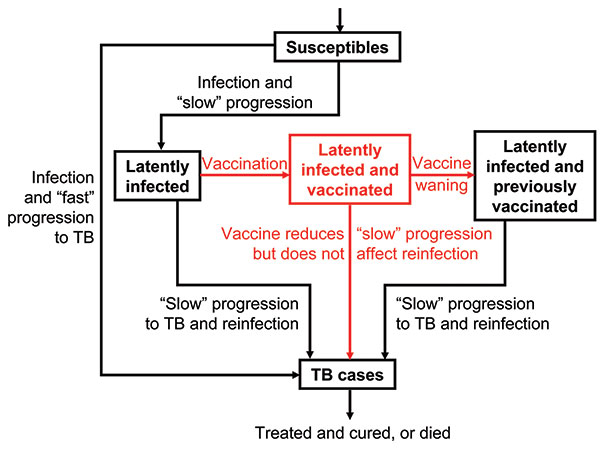
Figure 2. Flow-diagram of preexposure tuberculosis (TB) vaccine model. States and processes that relate to the vaccine are shown in red. Equations are given in the Appendix.
Page created: March 25, 2011
Page updated: March 25, 2011
Page reviewed: March 25, 2011
The conclusions, findings, and opinions expressed by authors contributing to this journal do not necessarily reflect the official position of the U.S. Department of Health and Human Services, the Public Health Service, the Centers for Disease Control and Prevention, or the authors' affiliated institutions. Use of trade names is for identification only and does not imply endorsement by any of the groups named above.