Volume 11, Number 1—January 2005
Research
HEPA/Vaccine Plan for Indoor Anthrax Remediation
Figure 4
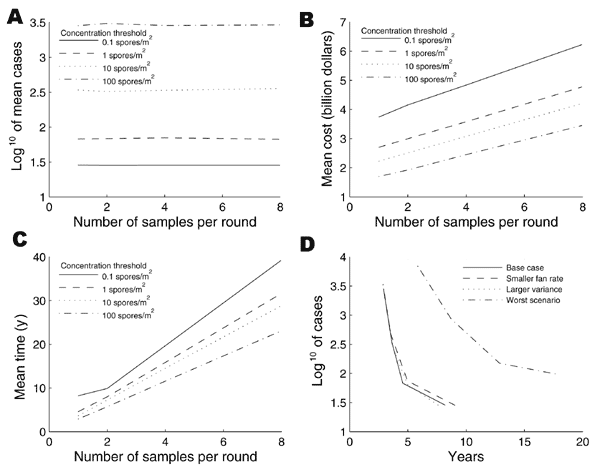
Figure 4. . . Performance of the HEPA/vaccine plan under the base-case scenario. The horizontal axes in plots A-C are the number of floor samples per round (). Each of plots A–C have 4 curves, 1 for each value of the floor concentration threshold (). Cleaning stops after the estimated floor concentration from samples per room is below the threshold . The vertical axes in plots A-C are A) the mean number of inhalation anthrax cases, B) the mean cost, and C) the mean recovery time. In plots A-C, the concentration threshold () has a much bigger impact than the number of samples per room () on these 3 performance measures. Plot D shows the tradeoff of anthrax cases versus recovery time in the base case. The number of samples per room is assumed to be = 1 in this plot, which is derived from plots A–C. Plot D also contains tradeoff curves for 3 sensitivity analyses: a lower air-cleaning rate, increased sampling variability of spore concentration, and the most severe of the 92 cases depicted in Figure 3B. This plot shows that the cases versus time tradeoff curve is very insensitive to changes in the air-cleaning rate and sampling variability.