Volume 11, Number 1—January 2005
Research
HEPA/Vaccine Plan for Indoor Anthrax Remediation
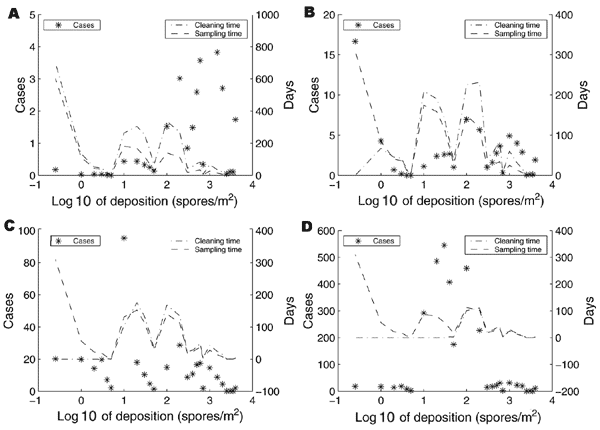
Figure 5

Figure 5. . . The horizontal axes in these 4 plots give the original room deposition level before remediation begins. These plots show how the total number of anthrax cases (the stars and the left vertical axes) are distributed across room deposition levels, e.g., in plot A, most of the anthrax cases occur in rooms with original deposition levels >100 spores/m2. Similarly, the 2 curves and the right vertical axis of each plot show how much time is spent cleaning and sampling in rooms of various deposition levels. These 4 plots are identical except that the spore concentration threshold in spores/m2 (c̅ ƒ), which dictates when remediation is stopped, is A) c̅ ƒ = 0.1; B) c̅ ƒ = 1; C) c̅ ƒ = 10; D) c̅ ƒ = 100. These plots motivate the hybrid policy, which fumigates heavily contaminated rooms and uses the HEPA/vaccine approach in lightly contaminated rooms.