Volume 11, Number 8—August 2005
Research
Modeling Control Strategies of Respiratory Pathogens
Figure 2

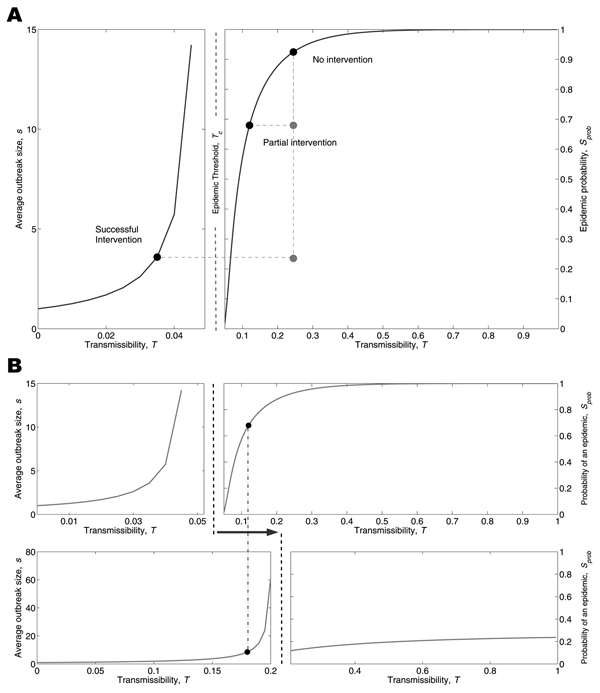
Figure 2. . Transmission- vs. contact-reduction intervention. A) Transmission-reduction intervention: solid curves show the average size of an outbreak (left panel) and the probability of a large-scale epidemic (right panel). The horizontal axes cover the spectrum of disease transmissibility (from 0 to 1) such that a single disease is associated with a unique value on either the left curve (if T<Tc) or the right curve (if T>Tc). The epidemic threshold Tc separates the 2 zones. For better visualization, we chose 2 different scales for horizontal axes of the 2 panels. Consider a disease with T = 0.245 (top black circle). A transmission-reduction intervention causes the black circle to slide on a new position on the curve. A successful intervention is the one that lowers T to a value <Tc. B) Contact-reduction intervention: solid curves in the top panel show the epidemiologic vulnerability of the original network. Contact-reduction interventions alter the structure of the contact network and shift the epidemic curves to the right (solid curves in bottom panel). The 2 dashed vertical lines show the critical transmissibility threshold for the old (left) and new (right) networks. Consider the disease denoted by the black circle: the contact-reduction intervention raised the epidemic threshold above transmissibility of the disease and thereby eliminated the possibility of an epidemic.
1These authors contributed equally to this work.
2For the purposes of this manuscript, "airborne" refers to respiratory pathogens that are spread through respiratory secretions and can be either airborne, such as tuberculosis, or dropletborne, such as SARS.