Skip directly to site content Skip directly to page options Skip directly to A-Z link Skip directly to A-Z link Skip directly to A-Z link
Volume 11, Number 8—August 2005
Research

Modeling Control Strategies of Respiratory Pathogens

Babak Pourbohloul*1Comments to Author , Lauren Ancel Meyers†‡1, Danuta M. Skowronski*, Mel Krajden*, David M. Patrick*, and Robert C. Brunham*
Author affiliations: *University of British Columbia Centre for Disease Control, Vancouver, British Columbia, Canada; †University of Texas at Austin, Austin, Texas, USA; ‡Santa Fe Institute, Santa Fe, New Mexico, USA

Main Article

Figure 7

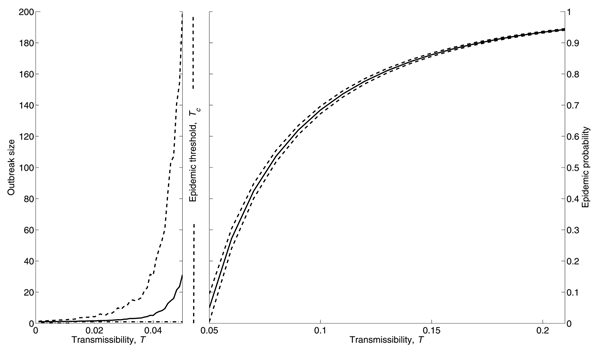
Left panel: variation of outbreak sizes as a function of transmissibility. We generated 1,000 epidemics for each of 20 values of T from 0 to the epidemic threshold. The solid curve represents the mean of outbreak size (m), the dashed curve represents 1 standard deviation above the mean (m + s), and the dotted line at the bottom shows the minimum size of an outbreak, which is always equal to 1, meaning that after the introduction of the first infected case the disease did not spread further. Righ

Figure 7. . Left panel: variation of outbreak sizes as a function of transmissibility. We generated 1,000 epidemics for each of 20 values of T from 0 to the epidemic threshold. The solid curve represents the mean of outbreak size (m), the dashed curve represents 1 standard deviation above the mean (m + s), and the dotted line at the bottom shows the minimum size of an outbreak, which is always equal to 1, meaning that after the introduction of the first infected case the disease did not spread further. Right panel: sensitivity of epidemic probability to network stochasticity. We generated 100 different networks, each with 2,000 households. Because of the stochastic nature of contact formation during network generation, these 100 networks contain different numbers and configurations of edges and therefore have different degree distributions. The solid curve shows the mean probability of an epidemic across the 100 networks for transmissibilities above the epidemic threshold, and the dashed curves are 95% confidence limits for the mean probability of an epidemic.

Main Article

1These authors contributed equally to this work.

2For the purposes of this manuscript, "airborne" refers to respiratory pathogens that are spread through respiratory secretions and can be either airborne, such as tuberculosis, or dropletborne, such as SARS.

Page created: April 23, 2012
Page updated: April 23, 2012
Page reviewed: April 23, 2012
The conclusions, findings, and opinions expressed by authors contributing to this journal do not necessarily reflect the official position of the U.S. Department of Health and Human Services, the Public Health Service, the Centers for Disease Control and Prevention, or the authors' affiliated institutions. Use of trade names is for identification only and does not imply endorsement by any of the groups named above.
file_external