Volume 13, Number 1—January 2007
Research
Similar Biochemical Signatures and Prion Protein Genotypes in Atypical Scrapie and Nor98 Cases, France and Norway
Figure 1
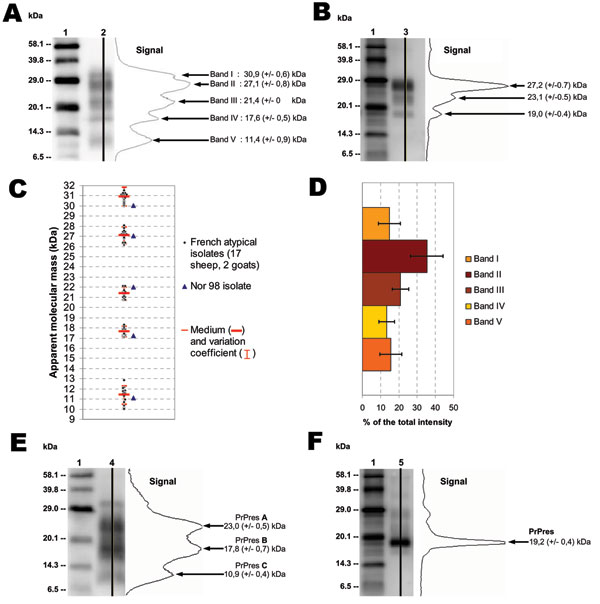
Figure 1. Atypical scrapie and Nor98 isolates PrPres Western blot pattern. Western blot (WB) profile in atypical (A, lane 2) and classic (B, lane 3) scrapie isolates with curves of chemiluminescence measured along the lane and corresponding apparent MWs (MWs), assessed by Bio-Rad Quantity One software analysis after signal capture using Versa Doc5000. Molecular weight (MW) standard (lanes 1). WB profiles of French atypical isolates in sheep (n = 17) and goats (n = 2) were compared with those of a Nor98 isolate. Apparent molecular masses (C) and proportions (D) of bands I to V were assessed from 3 independent runs for each sample by Bio-Rad Quantity One software analysis after signal capture using Versa Doc5000. Apparent MWs are measures for each of the atypical scrapie isolates, and proportions of bands are the means and standard deviations in the 19 atypical scrapie isolates. WB profiles of PrPres after PNGase deglycosylation with curves of chemiluminescence in atypical (E, lane 4) and classic (F, lane 5) scrapie isolates. Apparent MWs were estimated by comparison with a MW standard (lanes 1) from 10 independent runs.