Skip directly to site content Skip directly to page options Skip directly to A-Z link Skip directly to A-Z link Skip directly to A-Z link
Volume 13, Number 12—December 2007
Research

Phenotypic Similarity of Transmissible Mink Encephalopathy in Cattle and L-type Bovine Spongiform Encephalopathy in a Mouse Model

Thierry G.M. Baron*Comments to Author , Anna Bencsik*, Anne-Gaëlle Biacabe*, Eric Morignat*, and Richard A. Bessen†
Author affiliations: *Agence Française de Sécurité Sanitaire des Aliments–Lyon, Lyon, France; †Montana State University, Bozeman, Montana, USA;

Main Article

Figure 4

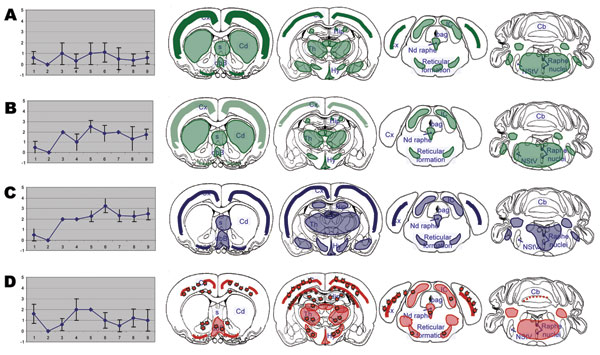
Brain lesion profiles (left panels) and disease-associated prion protein brain distribution (right panels) observed in the brain of TgOvPrP4 mice infected with L-type bovine spongiform encephalopathy (BSE), at first (A, n = 5) and second (B, n = 4) passages; TME in cattle (C, n = 5); or typical BSE (D, n = 4) at second passage. Brain vacuolation was scored (means ± standard deviations) on a scale of 0–5 in the following brain areas: 1) dorsal medulla nuclei, 2) cerebellar cortex, 3) superior colliculus, 4) hypothalamus, 5) central thalamus, 6) hippocampus, 7) lateral septal nuclei, 8) cerebral cortex at the level of thalamus, and 9) cerebral cortex at the level of septal nuclei. In right panels, showing the PrPd distribution, stars indicate the presence of florid plaques.

Figure 4. Brain lesion profiles (left panels) and disease-associated prion protein brain distribution (right panels) observed in the brain of TgOvPrP4 mice infected with L-type bovine spongiform encephalopathy (BSE), at first (A, n = 5) and second (B, n = 4) passages; TME in cattle (C, n = 5); or typical BSE (D, n = 4) at second passage. Brain vacuolation was scored (means ± standard deviations) on a scale of 0–5 in the following brain areas: 1) dorsal medulla nuclei, 2) cerebellar cortex, 3) superior colliculus, 4) hypothalamus, 5) central thalamus, 6) hippocampus, 7) lateral septal nuclei, 8) cerebral cortex at the level of thalamus, and 9) cerebral cortex at the level of septal nuclei. In right panels, showing the PrPd distribution, stars indicate the presence of florid plaques.

Main Article

Page created: July 06, 2010
Page updated: July 06, 2010
Page reviewed: July 06, 2010
The conclusions, findings, and opinions expressed by authors contributing to this journal do not necessarily reflect the official position of the U.S. Department of Health and Human Services, the Public Health Service, the Centers for Disease Control and Prevention, or the authors' affiliated institutions. Use of trade names is for identification only and does not imply endorsement by any of the groups named above.
file_external