Skip directly to site content Skip directly to page options Skip directly to A-Z link Skip directly to A-Z link Skip directly to A-Z link
Volume 13, Number 6—June 2007
Research

Isolation and Characterization of Novel Human Parechovirus from Clinical Samples

Kanako Watanabe*†, Masayasu Oie*, Masaya Higuchi*, Makoto Nishikawa†, and Masahiro Fujii*Comments to Author 
Author affiliations: *Niigata University Graduate School of Medical and Dental Sciences, Niigata, Japan; †Niigata Prefectural Institute of Public Health and Environmental Sciences, Niigata, Japan

Main Article

Figure

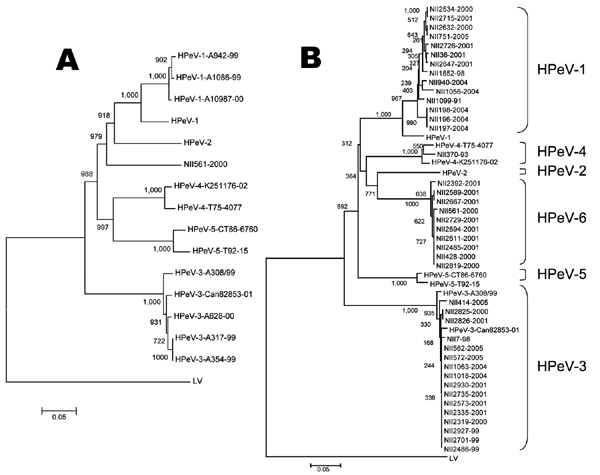
Phylogenetic tree analysis of the NII561-2000 virus and the NII561-2000–related viruses. A) The phylogenetic tree of P1 amino acid sequences was constructed as described in Materials and Methods. Bar shows a genetic distance of 0.05. The following amino acid sequences were obtained from GenBank: L02971 for HPeV-1 (Harris strain), AJ005695 for HPeV-2 (Williamson strain), AB084913 for HPeV-3 (A308/99), AJ889918 for HPeV-3 (Can82853-01), DQ315670 for HPeV-4 (K251176-02), AM235750 for HPeV-4 (T75-40

Figure. Phylogenetic tree analysis of the NII561-2000 virus and the NII561-2000–related viruses. A) The phylogenetic tree of P1 amino acid sequences was constructed as described in Materials and Methods. Bar shows a genetic distance of 0.05. The following amino acid sequences were obtained from GenBank: L02971 for HPeV-1 (Harris strain), AJ005695 for HPeV-2 (Williamson strain), AB084913 for HPeV-3 (A308/99), AJ889918 for HPeV-3 (Can82853-01), DQ315670 for HPeV-4 (K251176-02), AM235750 for HPeV-4 (T75-4077), AF055846 for HPeV-5 (CT86-6760), AM235749 for HPeV-5 (T92-15), and AF020541 for Ljungan virus (LV). B) Phylogenetic relationships among the NII561-2000 virus, the NII561-2000–related viruses, and other prototype HPeVs based on comparisons of amino acid similarities of capsid protein (the first 200 aa of VP0 sequences). The tree was constructed by the neighbor-joining method, using ClustalX. Bootstrap values are expressed in percentages after sampling 1,000×. Bar shows a genetic distance of 0.05.

Main Article

Page created: June 16, 2011
Page updated: June 16, 2011
Page reviewed: June 16, 2011
The conclusions, findings, and opinions expressed by authors contributing to this journal do not necessarily reflect the official position of the U.S. Department of Health and Human Services, the Public Health Service, the Centers for Disease Control and Prevention, or the authors' affiliated institutions. Use of trade names is for identification only and does not imply endorsement by any of the groups named above.
file_external