Skip directly to site content Skip directly to page options Skip directly to A-Z link Skip directly to A-Z link Skip directly to A-Z link
Volume 13, Number 7—July 2007
Research

Effects of Internal Border Control on Spread of Pandemic Influenza

James G. Wood*†Comments to Author , Nasim Zamani†, C. Raina MacIntyre*†, and Niels G. Becker‡
Author affiliations: *National Centre for Immunisation Research and Surveillance of Vaccine Preventable Diseases, Sydney, New South Wales, Australia; †The University of Sydney, Sydney, New South Wales, Australia; ‡Australian National University, Canberra, Australian Capital Territory, Australia;

Main Article

Appendix Figure

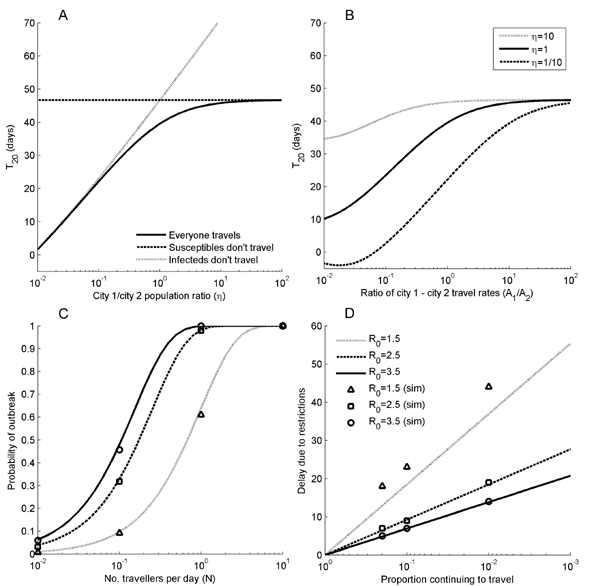
A)T20 (the time between the days on which the number of infected persons first reached 20 in city 1 and first reached 20 in city 2) (now deterministic) for reproduction number R0 = 1.5 and 6-day duration of infection, when the city size ratio, η = N1/N2, is varied. The epidemic is assumed to begin with 1 infectious person in city 1. Travel rates are equal (A1 = A2) with A1 = 1/1,000; solid, dotted, and dashed lines correspond to persons being free to travel, independent of disease state, only susceptible and removed persons traveling, and only infected persons traveling, respectively. B) Persons are free to travel regardless of disease state, with A1 = 1/1,000, but the reverse travel rate is varied. Solid, dotted, and dashed curves correspond to η = 1, 10, and 1/10, respectively. C) Probability of the outbreak spreading to city 2 as travel volume increases, with markers indicating results from simulations and curves from the analytic approximation. D) the analytic formula for effect of travel restrictions is compared with simulations of scenario 1 (an outbreak beginning in Sydney and spreading to Melbourne) by using the flat infectivity function. Horizontal axes are on a log-scale, and the legend in panel C also refers to panel D.

Appendix Figure. A)T20 (the time between the days on which the number of infected persons first reached 20 in city 1 and first reached 20 in city 2) (now deterministic) for reproduction number R0 = 1.5 and 6-day duration of infection, when the city size ratio, η = N1/N2, is varied. The epidemic is assumed to begin with 1 infectious person in city 1. Travel rates are equal (A1 = A2) with A1 = 1/1,000; solid, dotted, and dashed lines correspond to persons being free to travel, independent of disease state, only susceptible and removed persons traveling, and only infected persons traveling, respectively. B) Persons are free to travel regardless of disease state, with A1 = 1/1,000, but the reverse travel rate is varied. Solid, dotted, and dashed curves correspond to η = 1, 10, and 1/10, respectively. C) Probability of the outbreak spreading to city 2 as travel volume increases, with markers indicating results from simulations and curves from the analytic approximation. D) the analytic formula for effect of travel restrictions is compared with simulations of scenario 1 (an outbreak beginning in Sydney and spreading to Melbourne) by using the flat infectivity function. Horizontal axes are on a log-scale, and the legend in panel C also refers to panel D.

Main Article

Page created: June 24, 2010
Page updated: June 24, 2010
Page reviewed: June 24, 2010
The conclusions, findings, and opinions expressed by authors contributing to this journal do not necessarily reflect the official position of the U.S. Department of Health and Human Services, the Public Health Service, the Centers for Disease Control and Prevention, or the authors' affiliated institutions. Use of trade names is for identification only and does not imply endorsement by any of the groups named above.
file_external