Volume 15, Number 1—January 2009
Research
Enhanced Hygiene Measures and Norovirus Transmission during an Outbreak
Figure 3

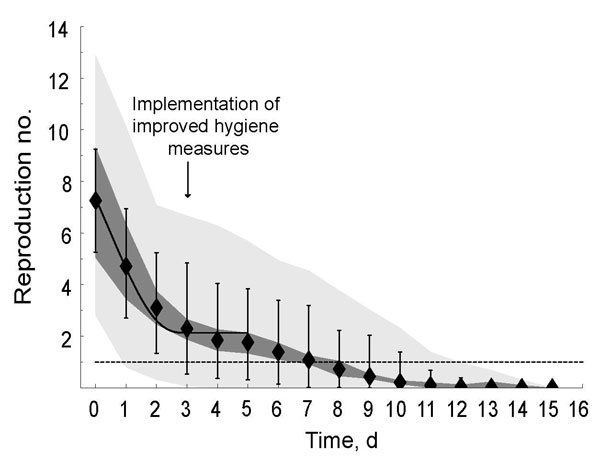
Figure 3. Time course of the reproduction number for norovirus at an international scout jamboree, starting July 26, 2004 (day 0), in the Netherlands. Black diamonds show the mean value for the reproduction number over all sampled transmission matrices; vertical lines, mean minimum and maximum values for the reproduction number over all sampled transmission matrices. The dark gray area shows the uncertainty range (0.025 and 0.975 quantiles) in the mean reproduction number; light gray are, the uncertainty range (0.025 and 0.975 quantiles) of the maximum and minimum estimates of the reproduction number. The solid black line represents the fitted time course of reproduction numbers if decrease in the mean reproduction number results from an instantaneous decline in transmission when enhanced hygiene measures began; dashed line, the threshold value of 1, below which the outbreak was controlled.