Volume 15, Number 2—February 2009
Research
Bacterial Phenotype Variants in Group B Streptococcal Toxic Shock Syndrome1
Figure 1
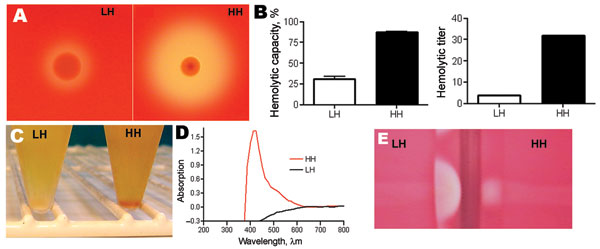
Figure 1. A) Hemolytic zone on blood agar plate after 48 h: Low hemolytic (LH) colony and high hemolytic (HH) colony. B) Hemolytic activity of the pigment extract presented as hemolytic capacity (left graph) relative to that of sodium dodecyl sulfate (100%) and as hemolytic titer (right graph) evaluated with a microdilution assay. Error bars indicate SEM. C) Phenotypic appearance of group B streptococci after overnight culture in Todd-Hewitt broth plus 1.5% yeast extract, displaying a white pellet (LH) and an orange pellet (HH). D) Absorbance profile of the pigment extract. E) Results of CAMP testing, which display a stronger reaction with the LH than with the HH phenotype.
1Part of this work was presented at Lancefield 2008 International Symposium on Streptococci and Streptococcal Diseases, Porto Heli, Greece, June 22–26, 2008.
2Current affiliation: Clinic for Infectious Diseases, University Hospital Bern, Bern, Switzerland.